
Introduction
Diarrhea is the most common cause of mortality in young calves, and therefore amounts to productivity and economic losses to the livestock industry. Despite our knowledge of the pathophysiology of calf diarrhea and technologies available for the identification of pathogens, its management remains a major challenge. Currently, Escherichia coli K99, Cryptosporidium, bovine rotavirus (BRV), and coronavirus have been found to be associated with calf diarrhea [1].
Most enteropathogens are known to cause both secretory and malabsorptive types of diarrhea. In secretory diarrhea, toxins from the enteropathogens, namely BRV and E. coli K99 induce secretion of sodium, chloride, and water into the intestinal lumen. Virus infection destroys mature enterocytes in villi causing villous atrophy, consequently decreasing the intestinal surface area for effective absorption of food. Following this, malabsorptive diarrhea sets in; unabsorbed glucose and other carbohydrates create an osmotic load pulling fluid into the lumen resulting in an increased fluid secretion from the crypts into the intestinal lumen relative to villous absorption, leading to diarrhea [2]. Loss of water and bicarbonates along with a decreased glomerular filtration rate in chronic diarrhea causes acid-base disturbances [3,4]. A decrease in strong ion difference (SID) is directly responsible for strong ion acidosis and acidemia, and therefore there has been a growing interest in studying the SID of electrolytes [5].
Acute-phase proteins (APPs) are a class of blood proteins whose concentration changes when animals are subjected to external or internal challenges, including infection, inflammation, surgical trauma, or stress. During an infection or tissue damage, the production of APPs increases in the liver, commonly referred to as acute-phase response [6]. APPs are considered as non-specific innate immune components that contribute to the restoration of homeostasis and inhibition of microbial growth [7]. Serum amyloid A (SAA) [8], haptoglobin (Hp) [9] and fibrinogen (Fb) [7,10] are some of the common APPs in cattle that are routinely used in diagnostic studies in cattle.
The purpose of this study was to investigate the pathogendependent changes in electrolyte levels and acid-base imbalance in diarrheic and non-diarrheic calves. We hypothesized that the analysis of APPs (SAA, Hp, Fb), electrolytes, and acid-base status could be managed better based on the identified causative enteropathogen.
Materials and Methods
One-hundred and forty-two diarrheic and non-diarrheic calves from nine farms in different parts of Korea were selected for this study (Korean native cattle, n = 119; Holstein, n = 23). The calves consisted of diarrheic and non-diarrheic calves. Blood samples were collected by venipuncture of the jugular vein using a 19 G needle and stored in an EDTA vacutainer tube for complete blood cell count and in a serum separator vacutainer tube for collecting serum. The blood was immediately centrifuged at 3,000 × g for 15 min at 4°C to harvest serum. Fecal samples were collected by rectal examination, and fecal score above 3 based on the Wisconsin university criteria was regarded as diarrhea (https://www.vetmed.wisc.edu/fapm/svm-dairy-apps/calf-health-scorer-chs).
Infections by enteropathogens, namely Cryptosporidium, E. coli K99, Salmonella, bovine coronavirus (BCV), bovine viral diarrhea virus (BVDV), BRV, and Eimeria, were considered as major risk factors for diarrhea in calves. The RNA was extracted from the feces using Trizol reagent (Takara, Japan) according to the manufacturer’s instructions. Single real time-polymerase chain reaction (RT-PCR) was performed using a one-step RT-PCR mixture (SolGentTM, Korea) and previously reported primers for the detection of specific genes for BCV, BRV, and BVDV [10-12]. Eimeria was detected by fecal examination.
The SAA, Hp, and Fb were measured using commercially available ELISA kits (Phase SAA, haptoglobin, Tridelta Development, Maynooth, Co, Ireland). Total protein in plasma and serum was measured using a refractometer (Rhino VET 360 Refractometer, Reichert Analytic instruments), and the difference obtained was considered as the fibrinogen concentration. Serum concentrations of glucose, blood urea nitrogen (BUN), sodium (Na+), chloride (Cl-), potassium (K+), bicarbonate (HCO3-), pH, and partial pressure of CO2 were measured using the i-stat portable clinical analyzer with CHEM8+ cartridges (Abbott Laboratories, USA). In order to evaluate strong ion acidosis or acidemia [13], SID was calculated based on the number of strong ions measured in serum as per the formula:
SID = ([Na+] + [K+]) - [Cl-].
Statistical analysis was performed using Statistical Package for the Social Sciences (IBM SPSS, Windows, Version 21.0, USA). The normality test was conducted using Kolmogorov-Smirnov and Shapiro-Wilk tests, while Mann-Whitney U-test was used to for comparisons within the groups. Furthermore, Kruskal-Wallis test was used to identify the differences in levels of APPs, electrolytes, and WBC counts depending on the nature of the infection.
Results
Enteropathogens and diarrhea
Fecal samples were collected from 141 calves, consisting of 109 (77.3%) non-diarrheic calves and 32 (22.7%) diarrheic calves, and were tested for enteropathogens. BVD, BCV, Eimeria, Cryptosporidium, BRV, and E. coli K99 were found in 44.7% (n = 63), 40.4% (n = 57), 19.8% (n = 28), 9.9% (n = 14), 4.9% (n = 7), and 0.7% (n = 1) of the samples, respectively; however, Salmonella could not be identified in any of the tested samples. Enteropathogens were detected in fecal samples from both diarrheic and non-diarrheic calves. In non-diarrheic calves, single pathogen infections were more common than co-infections, whereas infectious pathogens as part of co-infection were more common in diarrheic calves (Table 1).
Acute phase proteins, electrolytes, and acid-base laboratory analysis
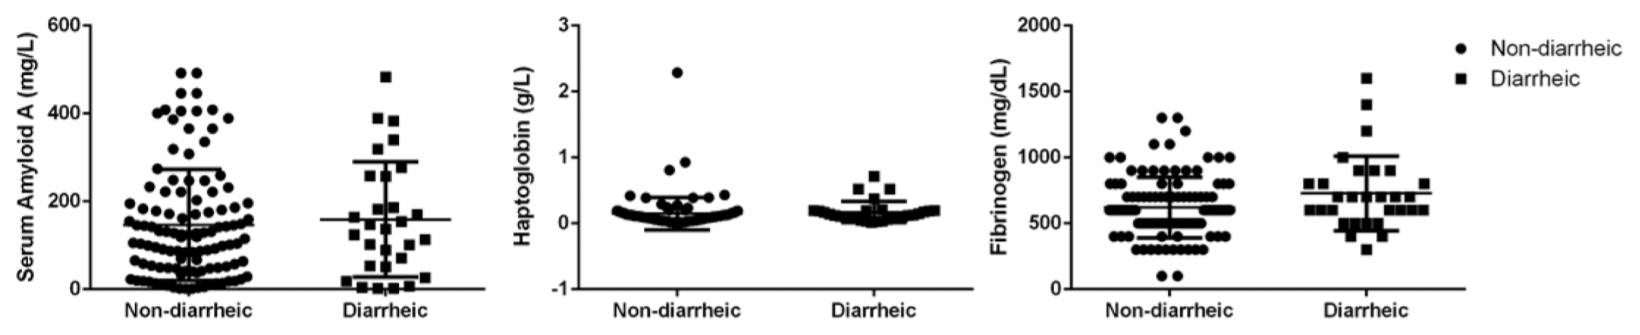
The overall SAA, Hp and fibrinogen concentrations in calves with diarrhea were not statistically significant when compared to calves with non-diarrhea (Fig. 1). The levels of Fb were significantly increased in calves with diarrhea (p = 0.033) when infected with BCV (p = 0.032) and Cryptosporidium (p = 0.011), but decreased significantly in case of Eimeria infection when compared with the corresponding non-diarrheic or infected/non-infected group (p = 0.042)
The electrolyte and acid-base imbalance analysis calves with diarrhea revealed hyponatremia (p < 0.01), hypochloremia (p < 0.05), decreased HCO3- (p < 0.05), and SID acidosis (p < 0.01). Diarrhea in calves also resulted in significantly low glucose (p < 0.001) and high BUN concentrations (p < 0.05). BRV-infected calves demonstrated similar results of hyponatremia (p < 0.01), decreased HCO3- (p < 0.01), SID acidosis (p < 0.01), hypoglycemia (p < 0.05), and elevated BUN (p < 0.01) when compared to the BRV non-infected calves. BCV infection resulted in increased SID levels, but the other parameters were comparable with the results obtained in the BCV non-infected group. Glucose concentration was significantly lower in Cryptosporidium-infected calves, but other parameters were comparable. No statistically significant changes in electrolytes or APP levels were observed in calves infected with Eimeria, and BVDV (Table 2). Based on the results obtained, young diarrheic calves with BRV infection were found to have significant clinicopathological changes as compared to the non-diarrheic group.
Discussion
The results of the study revealed the various enteropathogens and their combinations causing diarrhea, and the consequent changes in clinicopathological correlations, electrolyte levels, blood chemistry, and APP levels. The incidences of BCV and BVDV infections were found to be higher than other infectious enteropathogens in our study. Furthermore, there were different clinicopathological changes observed between the diarrheic and non-diarrheic calves, despite having the same infectious condition. Diarrhea in calves is reportedly related not only to infectious factors, but also to the non-infectious factors, namely, weather, housing, and sanitation [14]. Diarrhea induces excessive fluid loss and malabsorption in the small intestine, and thus influences clinicopathological changes in calves [4].
A decrease in electrolytes such as Na+, Cl-, and HCO3- has been shown in diarrheic calves due to excessive electrolyte loss and decreased intake of milk due to anorexia [4]. Moreover, hyponatremia causing a decrease in the SID values was observed in diarrheic calves. A decrease in the SID value indicates strong ion acidosis or acidemia, which is clinically important and acts as a signal to initiate therapy in the form of fluid administration in diarrheic calves [15]. Decreased HCO3- concentration due to loss into the intestine contributes to metabolic acidosis in diarrheic calves. The preliminary changes in electrolytes are primarily due to secretory diarrhea, which is one of the characteristics of infectious diarrhea in calves. The BRV diarrhea results in severe electrolyte loss and acid-base imbalance, and therefore aggressive therapeutic interventions are necessary for such situations. A decrease in glucose concentration causing negative energy balance in diarrheic calves suggests malabsorption, which is another aspect of infectious diarrhea [1]. A significant increase in BUN concentration along with a decreased glomerular filtration rate due to dehydration contributing to acidemia and metabolic acidosis in diarrheic calves has been reported [3]. An increase in the APP levels has been earlier reported during infectious and inflammatory states, and a similar pattern was demonstrated in this study in calves with diarrhea and infections except for some variations. The SAA levels did not show any significant changes with respect to diarrheal or infectious conditions. SAA is an APP of considerable importance with noticeable increments of 10-100-fold in response to acute stimulation [16]; however, it did not change significantly with diarrhea and infections in this study. These results could be attributed to two reasons. A clinical sign, like diarrhea, does not always have a correlation with the severity of infection [1]. Secondly, production of APP is stimulated not only by infections, but also by the presence of other factors, namely, stress, trauma, tissue damage, and colostrum. SAA concentration in young calves has been shown to depend on a variety of factors. McDonald et al. [17] reported that factors such as birth trauma, intake of colostral inducers such as cytokines, and stress could increase SAA concentrations. The SAA concentration was found to be the highest in young calves, and it decreased significantly with age. No significant differences were observed in the Hp levels in calves with diarrhea and infections, for reasons similar to that of SAA. The results of this study further confirmed that the changes in APPs did not always reflect clinical severity of the disease condition.
This study has demonstrated the pattern of clinicopathological changes in each group based on the identified enteropathogen. Different etiologies result in various forms of diarrhea, and this accordingly influences the clinicopathological parameters. Therefore, the analysis of clinicopathological parameters provides key information for the identification of the pathogens, diarrheal condition, and its management.
 PDF Links
 PubReader
 ePub Link
 Full text via DOI
 Download Citation
 Print
Print