Diagnostic imaging findings of subcutaneous mast cell tumor in a dog
Article information

Abstract
A 5-year-old Labrador Retriever presented with a subcutaneous mass on the right scapular region with localized calor. On magnetic resonance imaging (MRI), a heterogeneously hypointense mass was seen on T1-weighted images (WI) and hyperintense on T2WI and fat-suppressed T2WI with marginal contrast enhancement on postcontrast T1WI and invasion into the surrounding tissue. Histopathological examination of the mass confirmed subcutaneous mast cell tumor (MCT) infiltrating to the adjacent subcutaneous fat. This is the first report to describe the MRI findings of subcutaneous MCT in veterinary medicine. This study suggests that MRI may help evaluate the extent of invasion of subcutaneous MCT.
Mast cell tumors (MCT) are the most common cutaneous tumors in dogs, accounting for approximately 21% of all reported cutaneous tumors; most canine MCTs occur in the dermis and subcutaneous tissue [1,2]. The biological characteristics of cutaneous MCT are mainly evaluated by histopathological grading, which is important for prognostic assessment and therapeutic decision-making [3,4]. According to a previous study on the prognostic indices of canine subcutaneous MCT, histological pattern and incomplete surgical margin were identified as major risk factors for survival and local recurrence [2]. Because surgery is the preferred choice of treatment for controlling subcutaneous MCTs [2], evaluating the histologic patterns and extent of infiltration may be particularly important before surgical resection. In humans, magnetic resonance imaging (MRI) is commonly used to determine the extent of infiltration for skin tumor with its superior soft tissue resolution [5]; this may be applicable to animals. However, only one study described the MRI features of subcutaneous MCT [6]. Here, we describe the ultrasound, computed tomography (CT), and MRI findings of subcutaneous MCT in a dog.
A 5-year-old castrated male Labrador Retriever weighing 49.7 kg was referred to the Veterinary Medical Teaching Hospital of Kyungpook National University for a subcutaneous mass on the right scapula region. The mass was soft at first, and then became growing and hardened rapidly, and it seemed to cause itching. The physical examination revealed a broad-based, warm, firm, and immobile mass on the lateral aspect of the right scapula (Fig. 1A). The serum C-reactive protein level was markedly elevated (200 mg/L; reference range, 20–30 mg/L). Nonetheless, complete blood count and serum electrolyte were within the normal range.
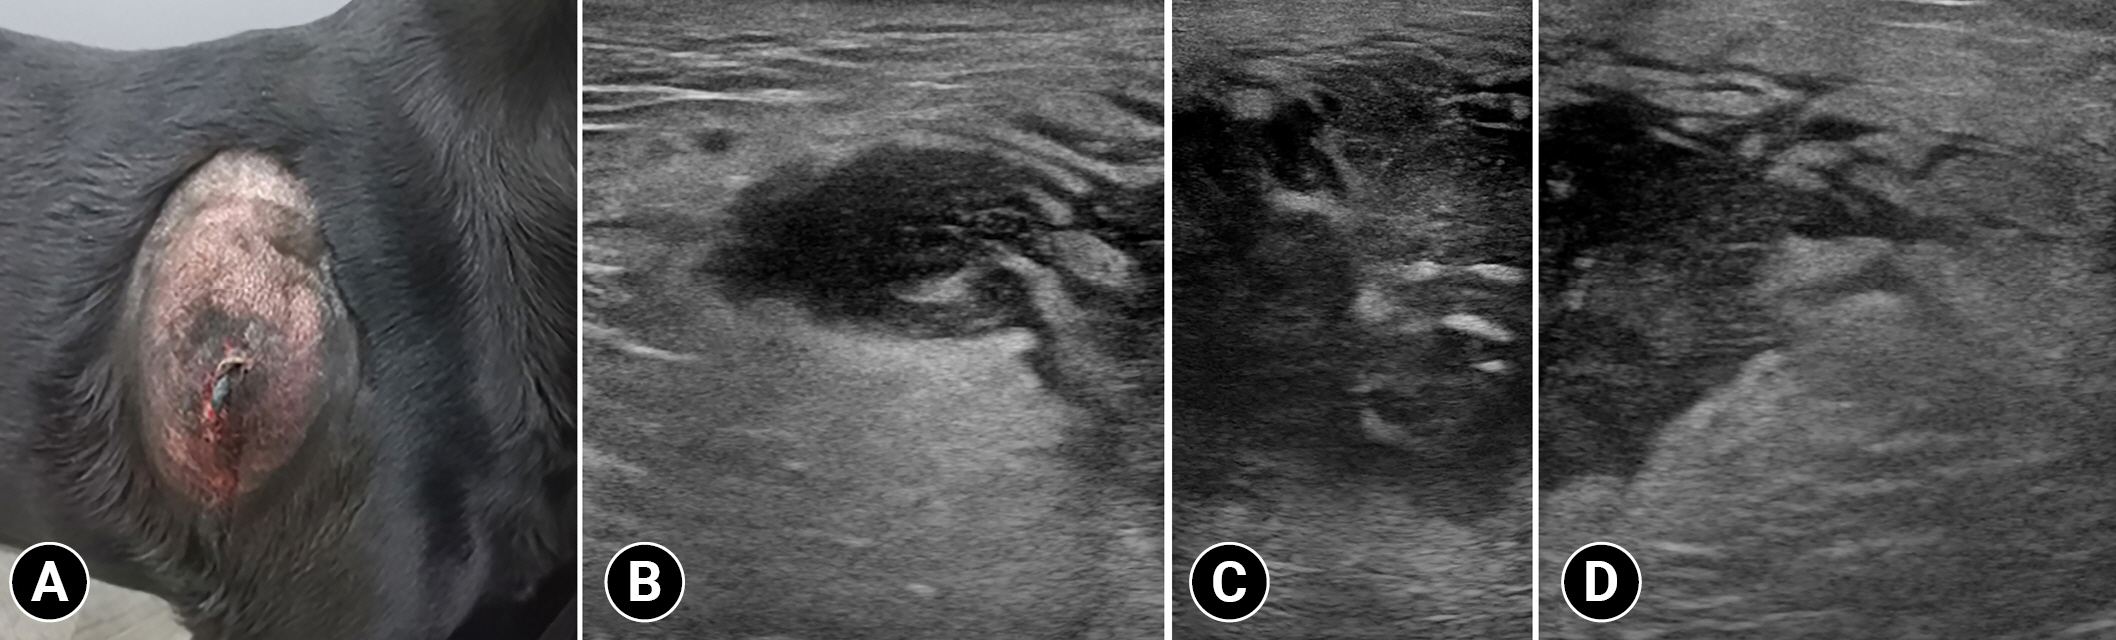
Photograph (A) and ultrasonographic images (B) of the mass in a dog with subcutaneous mast cell tumor. A warm, firm, and immobile mass is identified on the lateral aspect of the right scapula (A). Subcutaneous mass with ill-defined margin and hypoechoic and heterogeneous parenchyma containing hyperechoic foci (B–D).
Radiographs revealed a broad-based subcutaneous mass (6.8 cm) with soft tissue opacity on the right scapula. Ultrasound findings revealed that the mass had an ill-distinct margin and hypoechoic and heterogenous parenchyma containing hyperechoic foci (Fig. 1B–D). Further, color Doppler images revealed a minimal blood flow in the tumor parenchyma. Moreover, marked hyperechoic fatty change was observed adjacent to the mass. Thoracic CT was performed with a 32-multislice CT scanner (Alexion; Canon Medical Systems, Japan). The patient was premedicated with medetomidine (0.01 mg/kg, Domitor; Zoetis, Korea). Further, general anesthesia was induced with propofol (5 mg/kg, Anepol; Hana Pharm, Korea) and maintained with 2% isoflurane. Next, the patient was positioned in ventral recumbency on the CT table. The scanning parameters were as follows: 120 kV; 150 mA; slice thickness=1.0 mm; and rotation time=0.75 seconds. A contrast-enhanced examination was performed after the intravenous administration of 300 mgI/kg iohexol (Bonorex 300 injection; Daehan Pharm, Korea) for 30 seconds using an autoinjector (A-60; Nemoto Kyorindo Co., Japan). Further, postcontrast CT images of the early and delayed phases were obtained 30 and 90 seconds after injection, respectively. All CT data were cross-sectionally reconstructed in the transverse, and sagittal planes at 3.0-mm slice thickness. Non-contrast images revealed an ovoid-shaped slightly heterogeneous mass with ill-defined margins (Fig. 2A). Contrast enhancement of the mass parenchyma was not identified and the attenuation value of the parenchyma was approximately 20 HU in non- and postcontrast images. However, this mass had mild marginal contrast enhancement, and non-contrast-enhanced fat stranding adjacent to the mass was identified (Fig. 2B). The right axillary lymph node was mildly enlarged. There was no evidence of osteolysis of the right scapula and distant metastasis. The differential diagnoses of a heterogeneous subcutaneous mass with poorly defined margin were severe fat inflammation, subcutaneous abscess, and soft tissue mass with lymphadenopathy.
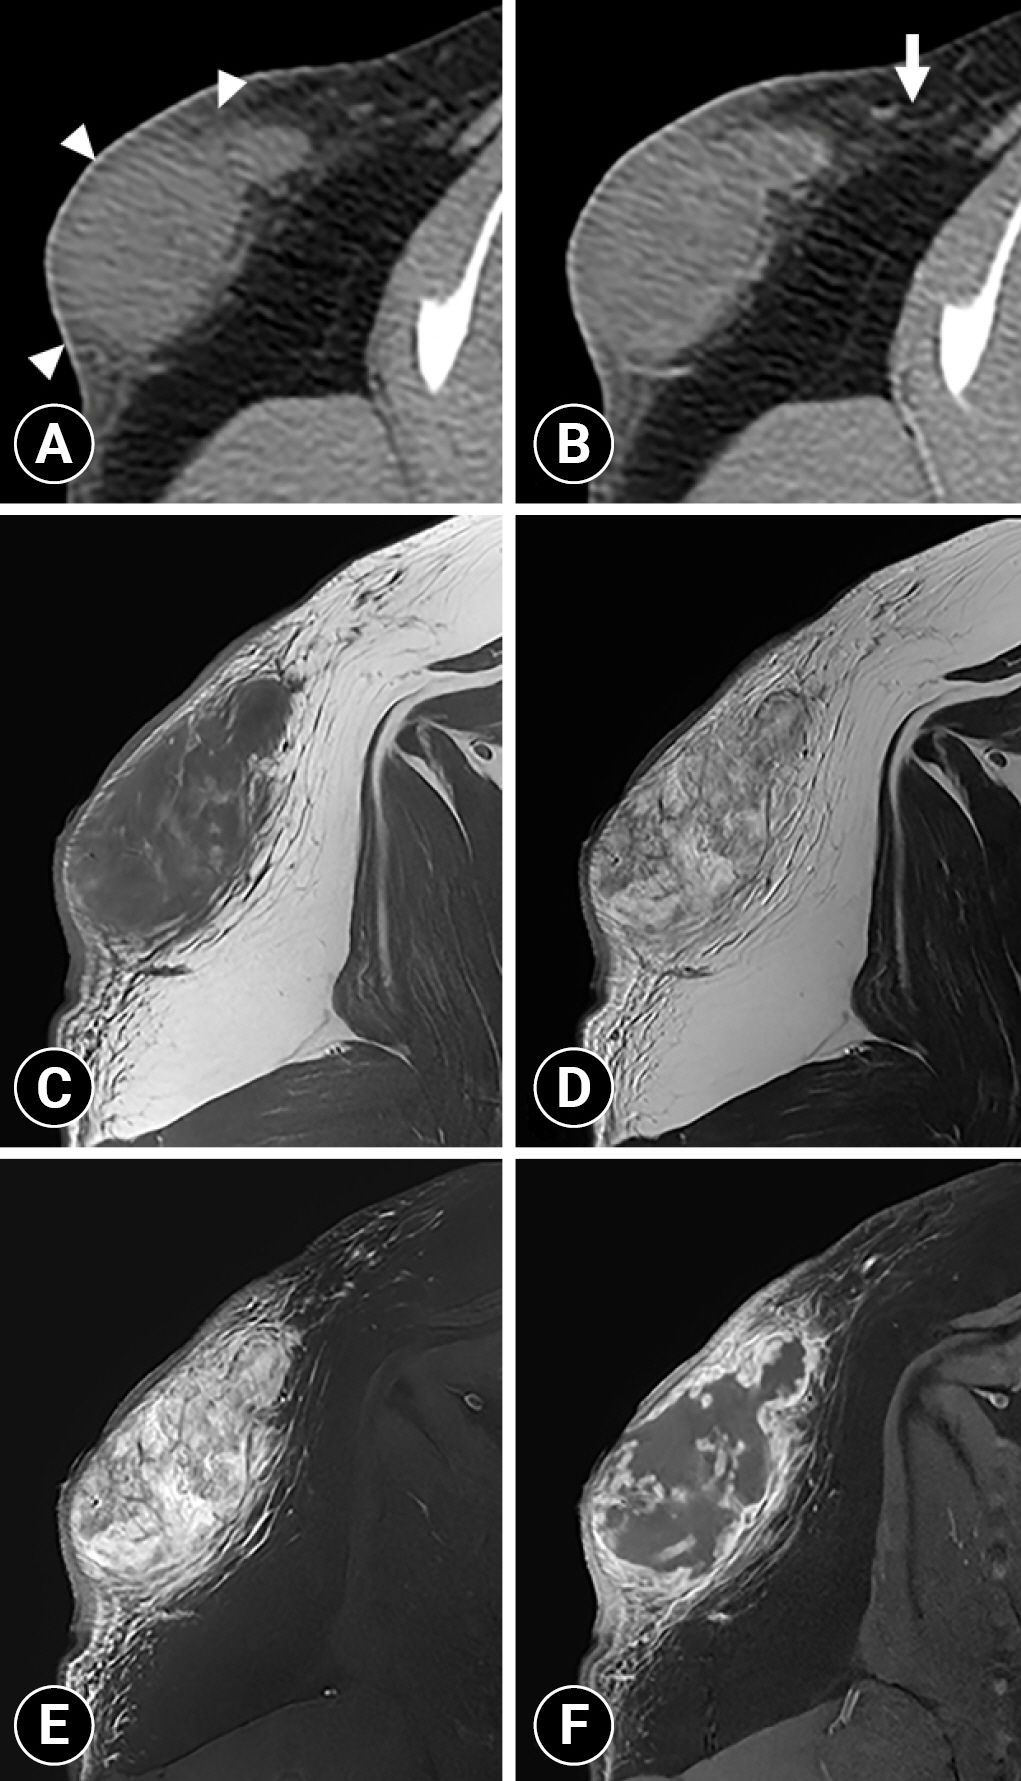
Non-contrast (A) and postcontrast (B) transverse computed tomography images and T1-weighted (T1W) (C), T2-weighted (T2W) (D), fat-suppressed T2W (E), and postcontrast fat-suppressed T1W (F) magnetic resonance images of the right scapula. The mass has ill-defined margins and an ovoid shape and is slightly heterogeneous with mild marginal contrast enhancement (arrowheads). Fat stranding is observed adjacent to the mass without contrast enhancement (arrow). The mass is heterogeneously hypointense on T1W images and heterogeneously hyperintense on T2W and fat-suppressed T2W images. On postcontrast fat-suppressed T1W images, marked marginal enhancement is observed.
Subsequently, to identify the extension and invasion of the subcutaneous mass, MRI was performed using the 1.5 T MR system (Signa explorer; GE Healthcare, USA). Under general anesthesia, the patient was positioned in the ventral recumbency, and the images were obtained with spin-echo sequences with a 16-channel flexible coil. T1-weighted (T1W) images time to repeat [TR] = 621 ms and time echo [TE] 9 ms, matrix size = 380 × 240, T2-weighted (T2W) images (TR = 4,468 ms and TE = 65 ms, matrix size = 380 × 240), fat-suppressed T2W (TR = 5,083 ms and TE = 68, matrix size = 320 × 240) images, and postcontrast fat-suppressed T1W (TR = 699 ms and TE = 11 ms, matrix size = 380 × 260) images of the right scapula region were obtained. T2W sequences were obtained in the transverse, sagittal, and dorsal planes. T1W, fat-suppressed T2W and postcontrast fat-suppressed T1W sequences were scanned in the transverse plane with a 16 × 16 cm field of view, 2.5-mm slice thickness, and 0.5-mm interslice gap. Gadoterate meglumine at a dose of 0.3 mL/kg (Clariscan; GE Healthcare) was administered intravenously for the contrast examination. The mass was heterogeneously hypointense on T1W images and hyperintense on T2W images (Fig. 2C, D). The mass was not suppressed on fat-suppressed T2W images, suggesting that it was not a fat-containing lesion (Fig. 2E). High signal areas with no contrast enhancement were identified in the mass on T2W images, suggesting necrosis or fluid accumulation; however, they were not detected on CT (Fig. 2C, D, F). The mass had marked marginal enhancement with heterogeneous parenchymal enhancement on postcontrast fat-suppressed T1W images (Fig. 2C, F). In the fat around the mass, hyperintense lines were observed on fat-suppressed T2W images, and contrast enhancement was observed on postcontrast fat-suppressed T1W images (Fig. 2C, E, F). This peritumoral enhancement showed weaker enhancement than the marked marginal enhancement of the mass. Because the mass had an indistinct margin from the adjacent tissue on T1W, T2W, and fat-suppressed T2W images with marginal enhancement on postcontrast fat-suppressed T1W images, the tumor infiltration was suspected. Additionally, fluid-like high signal areas with feathery borders were detected on T2W images, suggesting peritumoral edema (Fig. 2D). These MRI findings suggested a soft tissue tumor with adjacent invasion.
Considering the possibility of local recurrence, the mass was extensively resected with a gross margin of 2 to 2.5 cm. The margin of the resected mass was histopathologically clean. Histopathological examination of the mass revealed round cell infiltration in the subcutaneous fat layer, and the round cells were surrounded by edema and keloidal tissue (Fig. 3A). The edema was more widely distributed than tumor cells. The tumor cells had hyperchromatic nuclei and abundant eosinophilic or basophilic cytoplasm (Fig. 3B). One mitotic figure was noted per 10 high power-fields; moreover, cell necrosis was observed inside the mass. These findings confirmed infiltrative subcutaneous MCT. At the 2-month follow-up, no recurrence or complications were noted.
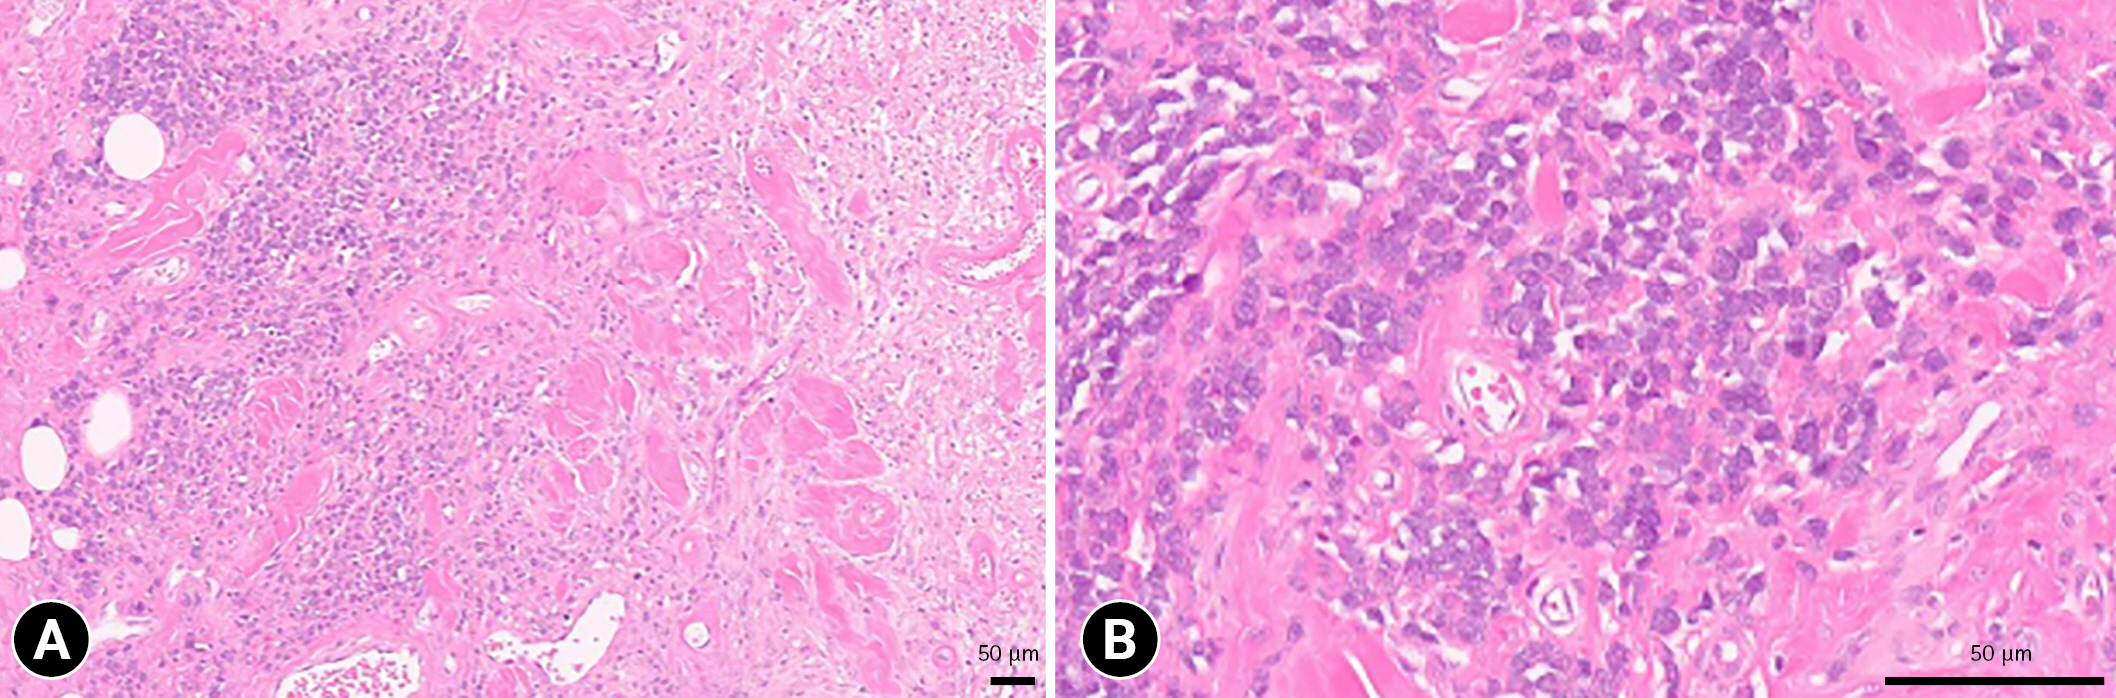
Histopathologic section of the mass. Round cell infiltration in the subcutaneous fat layer is observed, and the round cells are surrounded by edema and keloidal change (A). Tumor cells have hyperchromatic nuclei and abundant eosinophilic or basophilic cytoplasm (B). Hematoxylin and eosin stain, scale bar: 50 µm.
This report described ultrasound, CT, and MRI findings of subcutaneous MCT with an infiltrative growth pattern in a dog. Compared with ultrasound and CT, MRI provided detailed information about the lesion and its invasion into the surrounding tissues.
Only a few reports have described the imaging findings of subcutaneous MCTs in dogs [6,7]. For example, a previous study reported B-mode ultrasonography findings of infiltrative subcutaneous MCTs in 2 dogs [7]. The tumor of these 2 dogs had hypoechoic parenchyma with heterogeneous echotexture with encapsulation and invasion of adjacent tissue [7]. In addition, the study suggested that heterogeneous echotexture, invasion to adjacent tissues, hyperechogenic spots, and cavitary areas were associated with malignancy in cutaneous and subcutaneous tumors [7]. Notably, the heterogeneous echotexture indicated presence of different structural components such as cavitary areas, fibrotic foci, or microcalcifications [7]. The imaging features of the mass in the present case were consistent with those of malignancy in the previous study. However, the encapsulation of the mass was not identified in our case. This may be attributed to different degrees of invasion into the adjacent tissue. In a recent study, CT features of subcutaneous MCTs were mild contrast enhancement with heterogeneity and isoattenuation into adjacent muscles [6], and these features were consistent with those of MCTs in our study. In studies describing CT and MRI features of cutaneous MCTs, most tumors had well-defined margins [8,9]; however, in our study, the mass had ill-defined margins, indicating its invasion into the surrounding fat tissue.
A previous study reported that the MRI features of high-grade soft tissue sarcoma in subcutaneous tissue include heterogeneous signal intensities on T2W images, peritumoral contrast enhancement, and necrotic areas that were observed as high signals on T2W images without contrast enhancement [10]. Peritumoral edema, which often accompanies the tumor, appears as a fluid-like signal on T2W images with feathery borders that are distinguishable from the apparent tumor margins [10]. In the present case, the MRI features of the necrotic areas (high signal areas on T2W images with no contrast enhancement) and peritumoral edema (fluid-like signal on T2W images with feathery borders) were detected, which is consistent with the previous study and confirmed by histopathology. In addition, in the present case, heterogeneous signal intensities on T2W images and peritumoral contrast enhancement were detected, suggesting a subcutaneous malignant tumor.
A previous study classified the histological features of canine subcutaneous MCTs into 3 growth patterns for prognostic evaluation: circumscribed, combined (infiltrative-demarcated), and infiltrative [2]. The circumscribed pattern was characterized by well-demarcated mass, and the infiltrative pattern was characterized by a poorly demarcated mass with infiltrative growth into the adjacent fat [2]. Notably, the mitotic index was identified as the most significant risk factors for decreased survival time, moreover, the histological pattern was associated with 3.18 times higher mortality rate than the well-circumscribed pattern [2]. In the present study, the mass had an indistinct margin from the adjacent tissue on T1W, T2W, and fat-suppressed T2W images with marginal enhancement on postcontrast fat-suppressed T1W images, and this finding is consistent with the infiltrative growth pattern described in a previous study [11]. MRI could be used in humans to identify the growth pattern and preoperatively evaluate the extent of resection [11]. Based on the results of a study demonstrating the agreement between growth patterns on MRI and histological findings [11], our study results support that MRI may help evaluate histological patterns of subcutaneous MCT.
In MCT, treatment planning is done based on prognostic factors and the disease’s clinical stage [1]. Surgical excision is the treatment of choice for solitary MCTs with no evidence of metastasis [12]. Compared with cutaneous MCTs, subcutaneous MCTs are more effectively controlled by surgery alone, which has been demonstrated to be curative for most subcutaneous forms [2]. In a previous study, the local recurrence rates after complete and incomplete excisions were 2%, and 12% respectively [2]. A recent study reported that preoperative CT evaluation of subcutaneous MCTs is ineffective in distinguishing the tumor from normal tissue [6]. Identification of the range of invasiveness of the mass through excellent tissue contrast of MRI may help determine the surgical margin. In our case, extensive resection of the mass was conducted based on MRI findings, and there were no signs of recurrence or complications at the 2-month follow-up.
In conclusion, MRI may help differentiate subcutaneous soft tissue tumors from benign lesions as well as determine the range of invasion into the adjacent tissue, histological grade, and growth pattern. Canine infiltrative subcutaneous MCT had heterogeneous parenchyma on T1W and T2W images, and marginal enhancement with an indistinct margin on postcontrast T1W images.
Notes
The authors declare no conflict of interest.