마우스 T 세포 림프종 EL4 세포에 대한 metformin 단독 및 2-deoxy-D-glucose와 병용의 항암효과
Anticancer effect of metformin alone and in combination with 2-deoxy-D-glucose on mouse T cell lymphoma EL4 cells
Article information

Trans Abstract
Metformin is a treatment used widely for non-insulin-dependent diabetes mellitus with few side effects and acts by inhibiting hepatic gluconeogenesis and glucose absorption from the gastrointestinal tract. Lymphoma is one of the most common hematological malignancies in dogs. Chemotherapy is used mainly on lymphoma, but further research on developing anticancer drugs for lymphoma is needed because of its severe side effects. This study examined the anticancer effects of metformin alone and in combination with 2-deoxy-D-glucose (2-DG), a glucose analog, on EL4 cells (mouse T cell lymphoma). Metformin reduced the metabolic activity of EL4 cells and showed an additive effect when combined with 2-DG. In addition, cell death was confirmed using a trypan blue exclusion test, Hochest 33342/propidium iodide (PI) staining, and Annexin V/PI staining. An analysis of the cell cycle and mitochondria membrane potential (MMP) to investigate the mechanism of action showed that metformin stopped the G2/M phase of EL4 cells, and metformin + 2-DG decreased MMP. Metformin exhibited anticancer effects as a G2/M phase arrest mechanism in EL4 cells and showed additive effects when combined with 2-DG via MMP reduction. Unlike cytotoxic chemotherapeutic anticancer drugs, metformin and 2-DG are related to cellular glucose metabolism and have little toxicity. Therefore, metformin and 2-DG can be an alternative to reduce the toxicity caused by chemotherapeutic anticancer drugs. Nevertheless, research is needed to verify the in vivo efficacy of metformin and 2-DG before they can be used in lymphoma treatments.
서론
Metformin은 인슐린 비의존성 당뇨병(non-insulin-dependent diabetes mellitus) 치료에 이용되는 항고혈당제로, 저혈당 위험성이 낮아 널리 사용되고 있다[1,2]. Metformin은 미토콘드리아 전자전달계 complex Ⅰ에 작용하여 간의 포도당신생합성을 억제한다[3]. 또한 세포신호전달계인 adenosine monophosphate-activated protein kinase를 활성화하여[4], 세포의 성장과 대사에 관여하는 mammalian target of rapamycin을 억제하는 기전으로 항고혈당 효과를 나타낸다[5]. Metformin의 항암 효과가 밝혀진 이후로[6], metformin이 유방암[7], 췌장암[8], 난소암[9], 전립선암[10] 등에서 대사와 관련하여 항암 효과를 나타낸다는 연구들이 진행되었으나, 림프종에 대한 연구는 부족하다. 림프종은 개에서 가장 흔한 혈액 종양 중 하나로 대부분 부작용이 심한 화학요법 치료를 사용하기에[11], 림프종에 대한 추가적인 항암제 연구가 필요하다. 본 연구에서는 EL4 (T cell lymphoma) 세포에서 metformin의 항암 효과와 작용기전을 알아보았다.
미토콘드리아의 산화적 인산화를 통해 에너지를 얻는 정상 세포와는 달리 암세포들은 산소가 부족한 상황에서 해당 작용을 통해 에너지를 얻어 살아남는다. 이를 Warburg effect라 하는데[12], 에너지 생성 과정에서 탄소원인 포도당을 주로 사용하게 되며 지방이나 단백질은 거의 사용하지 않는다[13]. 이러한 이유로 암세포의 포도당 대사가 항암제의 표적으로 연구되고 있다[14]. 포도당 유사체인 2-deoxy-D-glucose (2-DG)는 해당과정에서 hexokinase Ⅱ에 의해 2-deoxy-D-glucose-6-phosphate로 변환되는데[15], 이는 해당과정의 진행을 막고 축적되어 에너지 결핍을 유발한다[16]. 이외에도 지속적인 자가포식 유도[17], 단백질의 N-연결 당화를 억제하는 항암 기전이 있다[18].
항고혈당제로 사용되는 metformin과 포도당 유사체인 2-DG는 둘 다 세포의 당대사 과정에 관여하여 항암 효과를 나타낼 수 있다. 이에 따라 본 연구에서는 T cell lymphoma 세포에서 작용기전이 유사한 두 약물의 병용 투여 시 항암 효과와 그 작용기전을 알아보았다.
재료 및 방법
세포주와 시약
본 실험에 사용된 EL4 세포주(mouse T cell lymphoma cell line)는 한국세포주은행(Korean Cell Line Bank)에서 구입하였다. 세포는 10% fetal bovine serum과 100 U/mL penicillin-streptomycin, 2 mM L-glutamine을 포함한 RPMI 1640 배지에서 37℃, 5% 조건으로 배양하였다. Metformin (Fujifilm Wako Pure Chemical, Japan)은 RPMI 1640 배지에, 2-DG (Tokyo Chemical Industry, Japan)는 멸균증류수에 희석하여 사용하였다.
세포의 대사활성도 측정
세포의 대사활성도 측정을 위해 MTT assay를 수행하였다. 1 × 10⁵ cells/mL 농도의 EL4 세포에 metformin 혹은 2-DG를 처리하여 96-well culture plate에서 3일 동안 배양하였다. 3-(4,5-dimethylthiazol-2-yl)-2,5-diphenyltetrazolium bromide (MTT; Sigma-Aldrich, USA) 시약을 10 μL/well로 처리한 후 37°C, 5% CO2 에서 4시간 동안 배양하였다. Mitochondrial reductase에 의해 생성된 formazan product (crystal violet)를 용해시키기 위해 10% sodium dodecyl sulfate 용액을 100 μL/well로 처리한 후 2시간 동안 반응시켰다. Microplate reader (Multiskan FC; Thermo Fisher Scientific, USA)를 이용하여 570 nm에서 흡광도를 측정하였다.
세포사 확인
Trypan blue exclusion test를 이용하여 세포 생존율을 측정하였다. 1 × 10⁵ cells/mL 농도의 EL4 세포에 metformin 혹은 2-DG 처리 후 3일 동안 배양한 세포를 trypan blue 시약으로 염색하였다. 혈구계산기(hemocytometer)를 이용하여 살아있는 세포와 죽은 세포의 갯수를 확인하였다. 세포의 핵에 Hoechst 33342와 propidium iodide (PI) 용액을 염색하여 형광현미경을 통해 세포사를 관찰하였다. 1 × 10⁵ cells/mL 농도의 EL4 세포에 metformin을 농도별로 처리하여 96-well culture plate에서 2일 동안 배양하였다. 세포에 Hoechst 33342 (Sigma-Aldrich)와 PI 용액을 한 well 당 각 2.5 μg/mL씩 처리하여 37℃에서 5분 동안 배양하였다. 촬영 2시간 전 suspension 세포의 촬영을 위해 96-well culture plate를 Poly-L-Lysine (Sigma-Aldrich) 0.01% (w/v)으로 코팅하였다. 형광현미경은 ZOE Fluorescent Cell Imager (BIO-RAD, USA)를 사용하였다.
유세포분석
유세포분석을 통해 세포주기 분석과 미토콘드리아 막전위(mitochondria membrane potential, MMP) 변화 분석, 세포사 확인을 수행하였다. 세포주기 분석을 위해 1 × 10⁵ cells/mL 농도의 EL4 세포에 metformin을 농도별로 처리하여 24-well culture plate에서 2일 동안 배양하였다. Phosphate buffered saline (PBS)으로 세척한 후 -20°C 에서 20분간 absolute ethanol로 고정하였다. 고정액 제거 후, 200 μg/mL로 RNase를 처리하여 실온에서 30분간 반응시켰고, 50 μg/mL 농도로 PI 용액을 10분간 염색하였다. 미토콘드리아 막전위 변화를 확인하기 위해 1 × 10⁵ cells/mL 농도의 EL4 세포에 metformin 혹은 2-DG 처리하여 24-well culture plate에서 1일 동안 배양하였다. 세포를 PBS로 세척한 후, 5,5’,6,6’-tetrachloro-1,1’,3,3’-tetraethylbenzimidazolylcarbocyanine iodide (JC-1; MedChemExpress, USA)로 염색하여 37℃, 5%에서 20분간 처리하였다. 반응 후 유세포분석 염색용액으로 2회 세척하였다. Apoptosis와 necrosis 확인을 위해 1 × 10⁵ cells/mL 농도의 EL4 세포에 metformin 혹은 2-DG를 처리하여 24-well culture plate에서 2일 동안 배양하였다. Annexin V-binding buffer로 세척한 후, annexin V-fluorescein isothiocyanate (Thermo Fisher Scientific)와 PI 용액을 각각 0.5 μg/mL와 1.5 μg/mL 농도로 처리하였다. 암실 조건에서 15분간 반응시켰다. 모든 염색된 세포는 CytExpert software (Beckman Coulter, USA)를 이용하여 유세포분석을 진행하였다.
통계 분석
통계 분석은 Prism 9 (GraphPad Software, USA)를 사용하여 실험 결과를 평균 ± 표준편차로 나타내었다. Ordinary one-way ANOVA 혹은 ordinary two-way ANOVA의 multiple comparison test를 이용하여 유의수준을 확인하였다.
결과
EL4 세포에서 metformin에 의한 대사활성도 감소
Metformin을 0–10 mM 농도로 처리한 EL4 세포에 MTT assay를 이용하여 대사활성도를 측정하였다(Fig. 1). 모든 농도(0–10 mM)에서 EL4의 대사활성도가 감소하였고, 특히 0.08 mM 이상의 농도에서 유의하게(p<0.0001) 감소시켰다. MTT assay 결과를 통해 구한 EL4 세포에 대한 metformin의 IC50 (the half maximal inhibitory concentration) 값은 0.07 mM이었다.
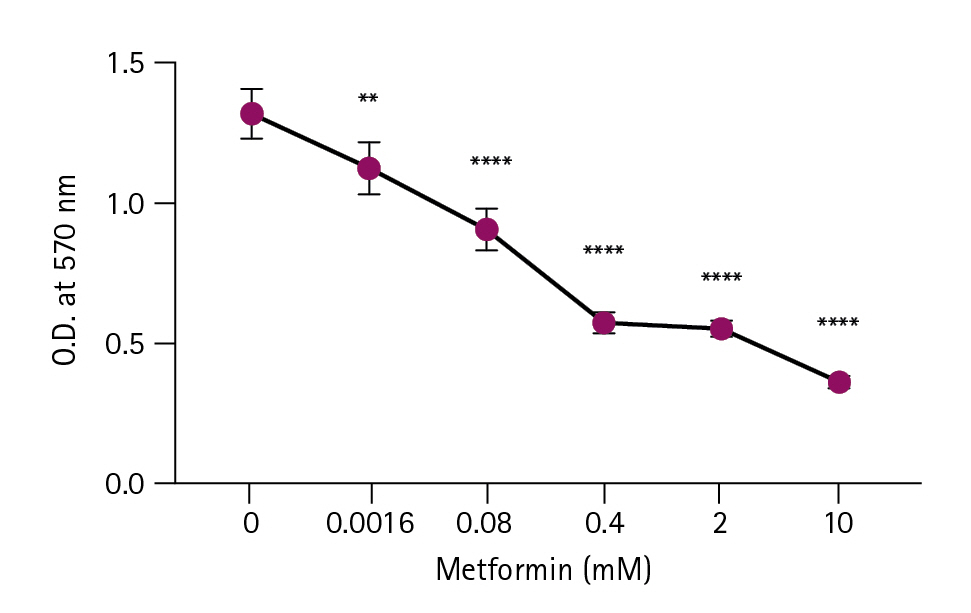
Metabolic activity of EL4 cells treated with metformin. EL4 cells were cultured in a 96-well culture plate at 1 × 10⁵ cells/mL and treated with 0 to 10 mM metformin. An MTT assay was performed after three days. The optical density (O.D.) was measured at 570 nm using a microplate reader. Statistical significance was performed by one-way ANOVA by multiple comparisons test. Compared to the control (0 mM). **p < 0.01, ****p < 0.0001.
EL4 세포에서 metformin에 의한 세포사 증가
세포사 확인을 위해 trypan blue 시약으로 염색한 세포를 혈구계산기를 이용하여 세포수를 계수하였다. EL4 세포에 metformin을 0.4 mM 혹은 2 mM 처리 시 대조군에 비해 세포생존율이 각각 15.6%, 25.7%씩 감소하였다(Fig. 2A). 세포생존율에 비해 살아있는 세포수는 크게 감소하는 양상을 보였다. Metformin 0.08 mM 혹은 0.4 mM, 2 mM을 처리한 세포군은 대조군에 비해 살아있는 세포수가 각각 55%, 82.6%, 88.7%씩 유의하게 감소하였다. Hochest 33342와 PI 용액으로 metformin을 처리한 EL4세포를 염색하여 세포사 여부를 확인하였다(Fig. 2B). 살아있는 세포는 Hochest 33342에 의해 푸른색으로 염색되었으며, 죽은 세포는 PI가 추가적으로 염색되어 분홍색을 나타내었다. Metformin 0.08 mM로 처리된 세포군의 경우 살아있는 세포수가 대조군과 유의하게 변하지 않았으나 0.4 mM과 2 mM로 처리된 세포군은 대조군에 비해 살아있는 세포수가 76%씩 감소하였다.
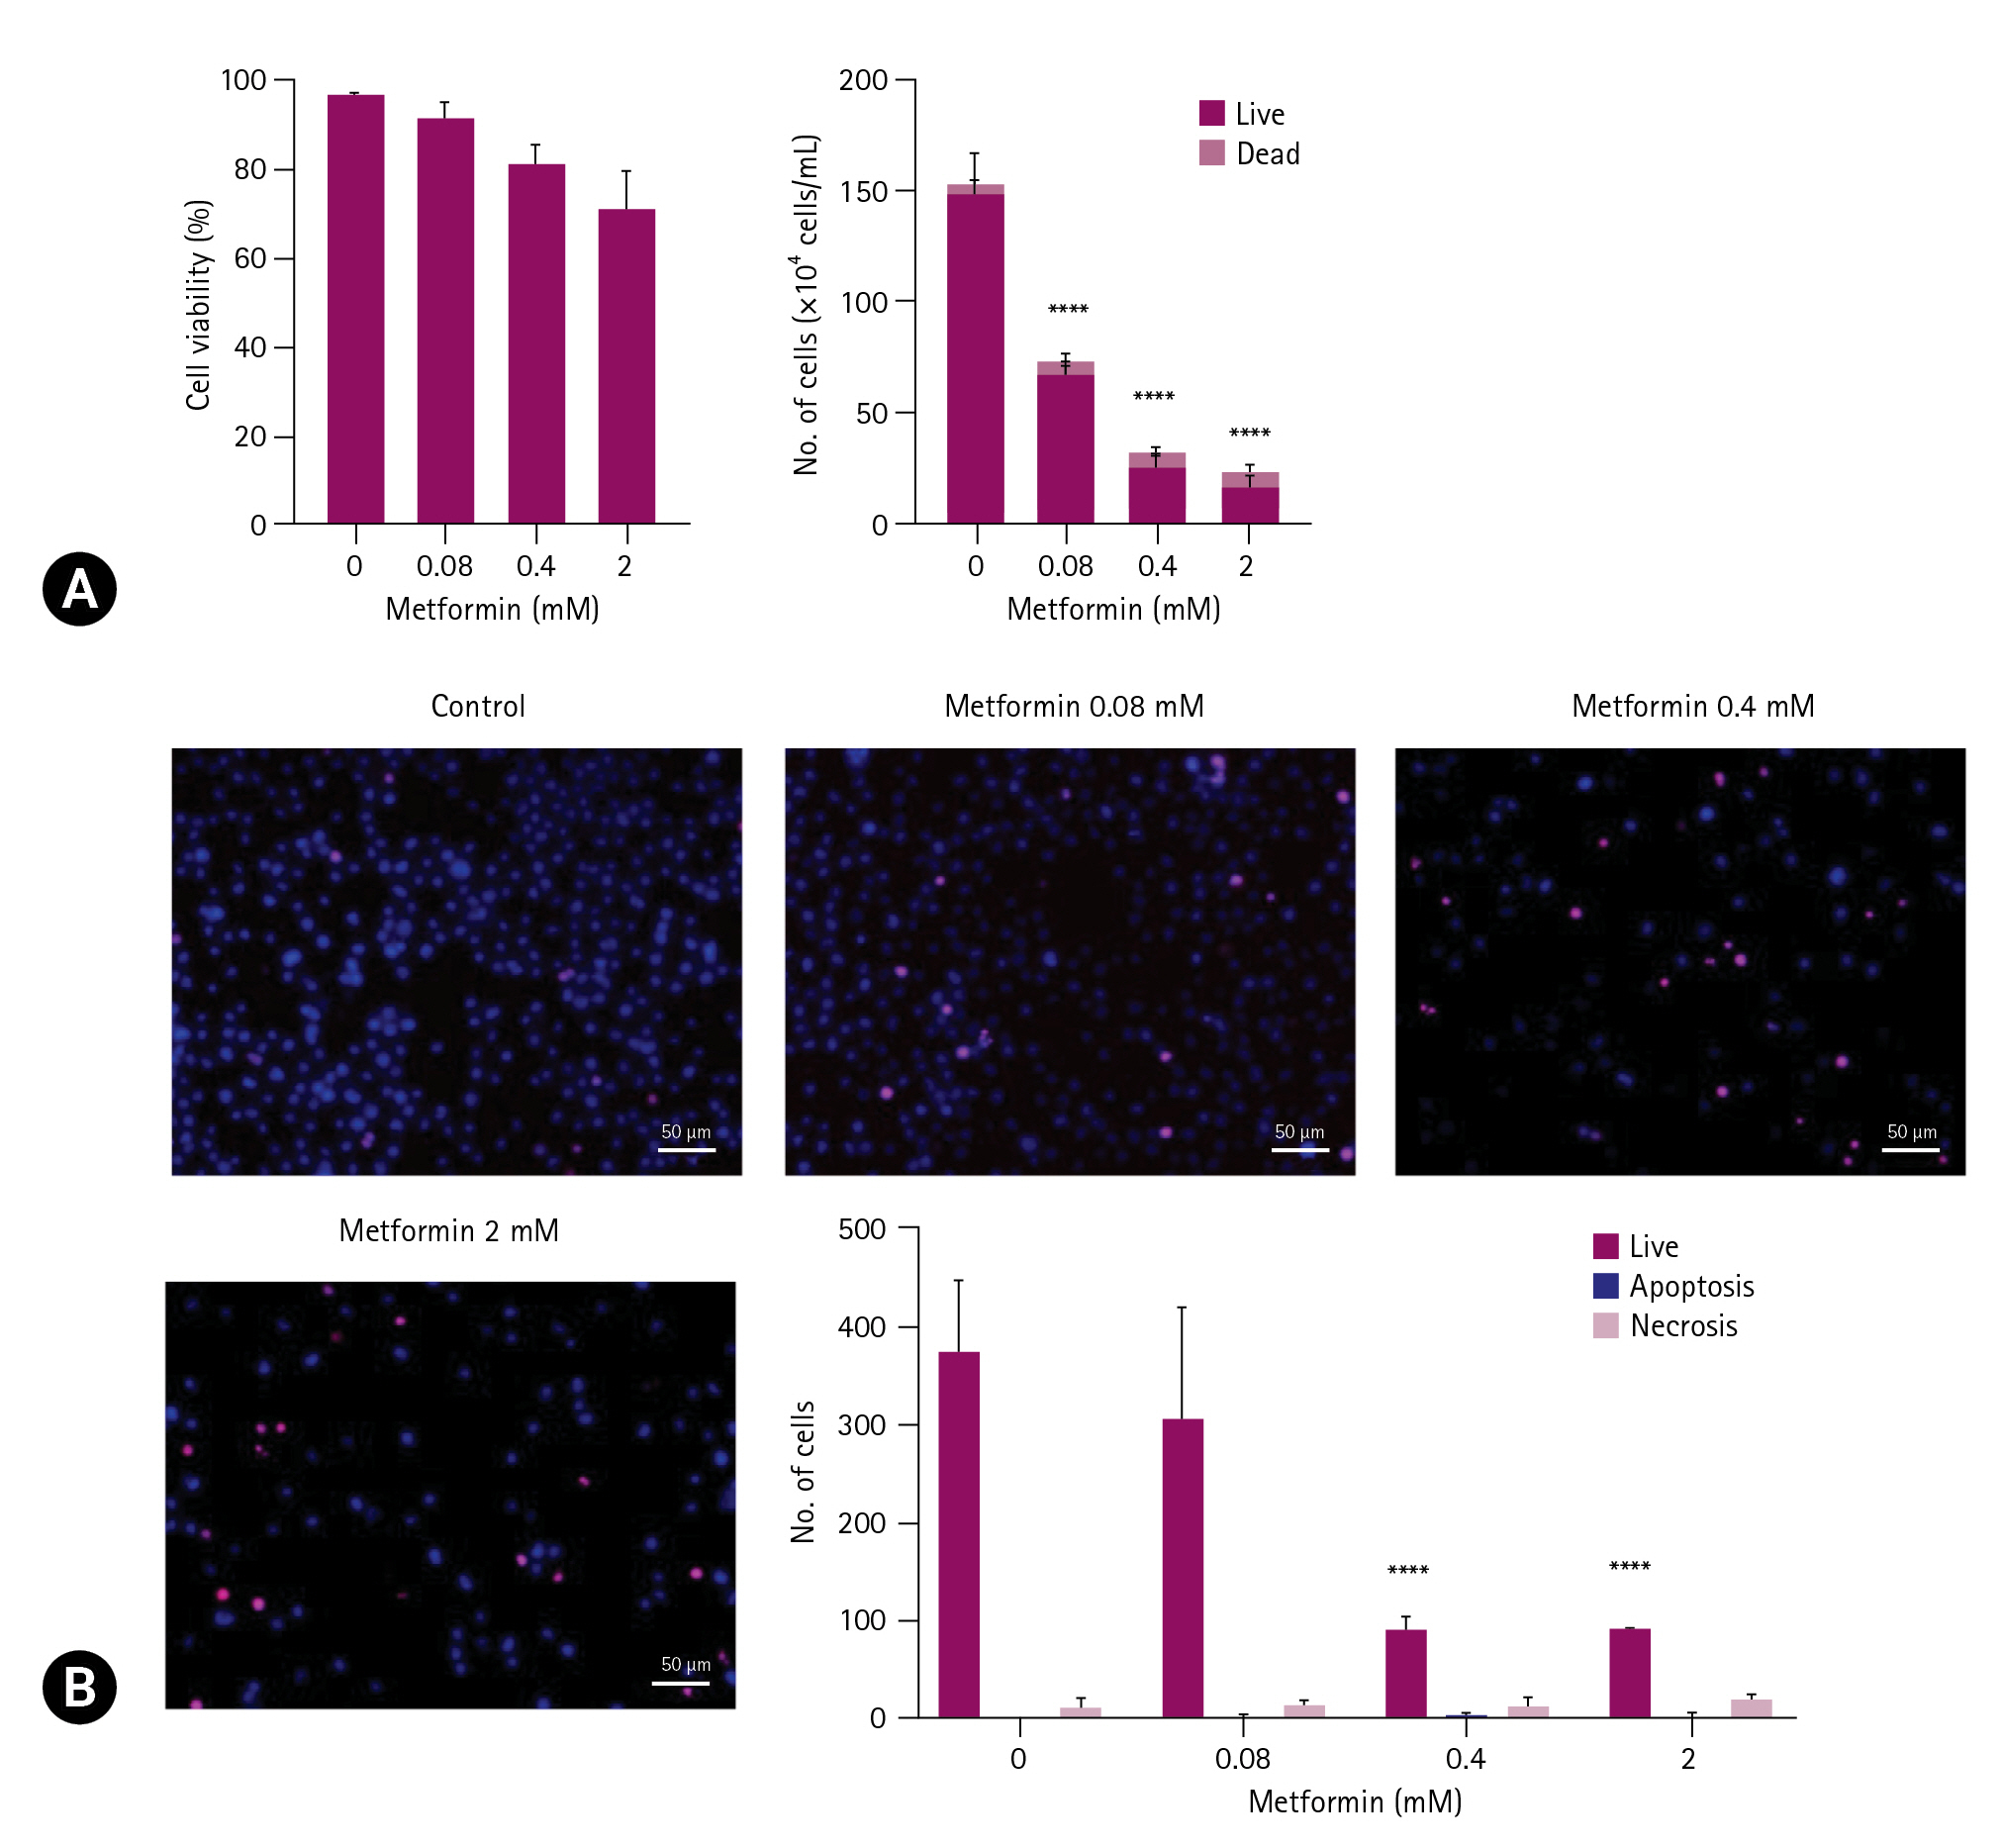
Metformin increases the cell death of EL4 cells. EL4 cells were cultured in 96-well culture plates at 1 × 10⁵ cells/mL and treated with metformin at 0.08 mM, 0.4 mM, and 2 mM. (A) After three days, cells were counted by staining with trypan blue solution. (B) After two days, fluorescence microscopy confirmed cell death by double staining with Hochest 33342 and propidium iodide (PI). The cells with fragmented nuclei were counted as apoptotic cells, and those with pink nuclei were counted as necrotic cells. Scale bar: 50 μm. Statistical significance was performed by two-way ANOVA, **** the number of live cells compared to that of control (0 mM) indicates p < 0.0001.
EL4 세포에서 metformin의 G2/M기 세포주기 정지 효과
Metformin이 EL4 세포의 세포주기에 영향을 미치는지 확인하기 위해 PI 용액으로 핵을 염색하여 유세포분석을 수행하였다(Fig. 3). Metformin 0.4 mM 농도에서 대조군과 비교하여 Sub G0/G1기에서 4.9% 증가하였으며 S기는 11.7% 감소하였고, G2/M기는 44.7% 증가하였다. 2 mM 농도에서는 대조군에 비하여 G0/G1기가 38.7% 감소하였고, S기는 17.4% 감소하였으며, G2/M 기는 48.9% 증가하였다. 따라서 0.4 mM 이상의 농도에서 Sub G0/G1기 세포가 증가하고, G2/M기 세포주기 정지로 인해 세포수가 증가하는 반면 G0/G1기와 S기의 세포가 감소됨을 알 수 있었다.
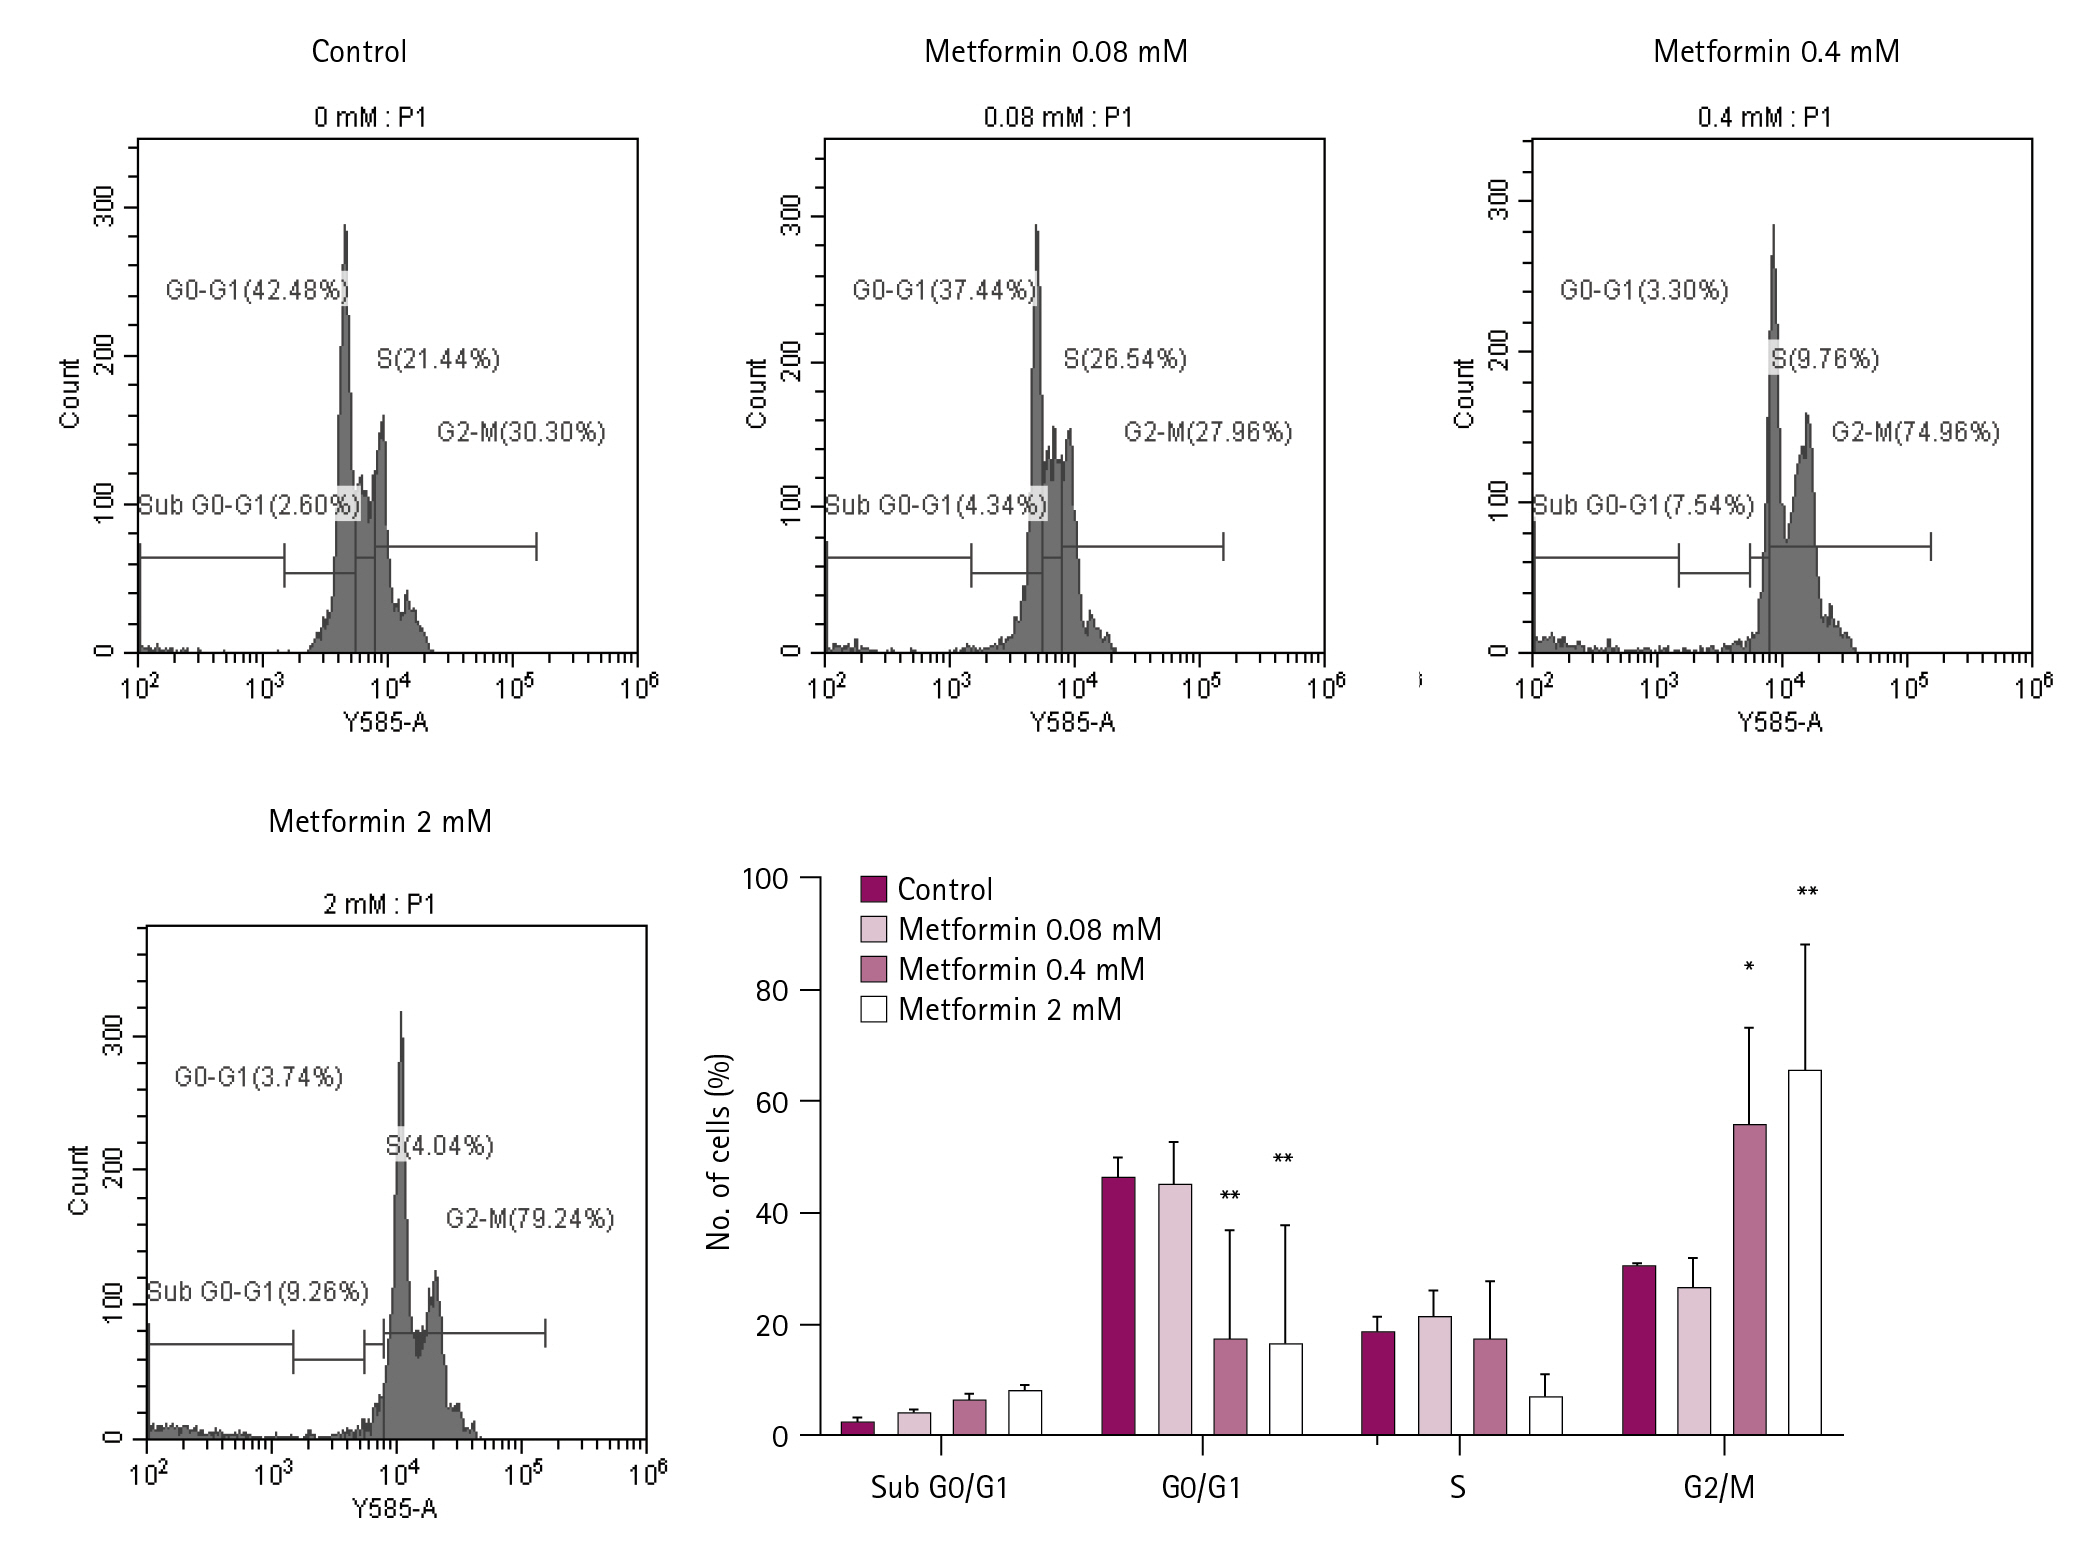
Metformin induces G2/M phase cell cycle arrest in EL4 cells. EL4 cells at 1 × 10⁵ cells/mL were treated with metformin at each concentration and cultured in a 24-well culture plate for two days. The cell cycle was confirmed by flow cytometry after propidium iodide staining. Percentages of each phase were indicated. Statistical significance was performed using two-way ANOVA. * and ** indicate p < 0.05 and p < 0.01, respectively, compared to the control (0 mM).
EL4 세포에서 metformin + 2-DG에 의한 대사활성도와 생존 세포의 감소
EL4 세포에서 metformin과 2-DG를 함께 처리했을 때의 세포 대사활성도 변화를 측정하기 위해 MTT assay를 시행하였다. EL4 세포에서의 2-DG의 IC50 값을 확인하기 위해 EL4 세포에 2-DG를 0–20 mM 농도로 처리하여 MTT assay를 진행한 후 통계 분석을 수행하였다(Fig. 4A). 2-DG는 농도의존적으로 대사활성도를 감소시켰으며, 1.25 mM 이상의 농도에서 유의하게 감소하였다. IC50 값은 1 mM로 분석되었다. Metformin을 농도별로 처리한 EL4 세포에 2가지 농도의 2-DG를 추가로 처리하였다(Fig. 4B). 2-DG의 농도는 EL4 세포에 대한 2-DG의 IC50 값을 고려하여 0.5 mM과 1 mM로 설정하였다. Metformin + 2-DG 0.5 mM을 처리한 세포군과 metformin + 2-DG 1 mM을 처리한 세포군은 metformin을 단독 처리한 세포군과 비교하여 Metformin의 0.016–2 mM 농도 범위에서 유의하게 대사활성도가 감소하였다. 세포생존율과 세포수 측정을 위해 trypan blue exclusion test를 시행하였다(Fig. 4C). Metformin 과 2-DG의 처리 농도는 IC50 값을 고려하여 각각 0.1 mM과 0.5 mM로 설정하였다. 세포생존율의 유의한 감소는 보이지 않았으나, 살아있는 세포수는 metformin 0.1 mM 또는 2-DG 0.5 mM을 단독으로 처리했을 때 대조군에 비해 각각 52%, 62.5%씩 유의하게 감소하였고, metformin과 2-DG를 함께 처리한 세포군은 유의하게 80.4% 감소하였다.

Metformin + 2-deoxy-D-glucose (2-DG) decreases the metabolic activity and the number of live cells in EL4 cells. EL4 cells were cultured in 96-well culture plates at a concentration of 1 × 10⁵ cells/mL, and treated with 2-DG (A) or 2-DG + metformin (B) at each concentration. An MTT assay was performed after three days. The optical density was measured at 570 nm using a microplate reader. (C) EL4 cells were treated with metformin 0.1 mM or 2-DG 0.5 mM. After three days, cell numbers were counted by staining with a Trypan blue solution. Statistical significance was performed by one-way- (A) or two-way- (B) and (C) ANOVA using a multiple comparisons test. Compared to the control (0 mM), *p < 0.05, **p < 0.01, ***p < 0.001 ****p < 0.0001. ##p < 0.01, ###p < 0.001, ####p < 0.0001 compared to same concentration control (B).
EL4 세포에서 metformin + 2-DG에 의한 MMP 변화와 세포사 확인
MMP 변화를 확인하기 위해 EL4 cell에 metformin 0.1 mM 또는 2-DG 0.5 mM를 처리한 후 JC-1으로 염색하였다(Fig. 5A). 2-DG 0.5 mM를 처리한 세포군과 metformin 0.1 mM + 2-DG 0.5 mM를 처리한 세포군에서 대조군에 비해 높은 막전위의 미토콘드리아를 가진 세포 비율이 각각 17%, 19%씩 감소하였으며, 낮은 막전위를 가진 세포 비율은 30%, 48%씩 증가하였다. 또한 Annexin V와 PI 염색 후 유세포분석을 통해 세포사를 확인하였다(Fig. 5B). 사분면은 각각 살아있는 세포(Annexin V-/PI-)와 early apoptosis (Annexin V+/PI-), late apoptosis (Annexin V+/PI+), necrosis (Annexin V-/PI+) 세포를 나타낸다. Metformin 0.1 mM 또는 2-DG 0.5 mM을 단독으로 처리한 세포군은 대조군에 비해 살아있는 세포가 각각 30%, 24%씩 감소하였고, necrosis가 29%, 24%씩 증가하여 세포사 중 necrosis가 가장 많았다. 반면, metformin 0.1 mM + 2-DG 0.5 mM을 처리한 세포군은 각 약물을 단독처리한 세포군보다 early apoptosis와 late apoptosis 세포 비율이 증가하였다.
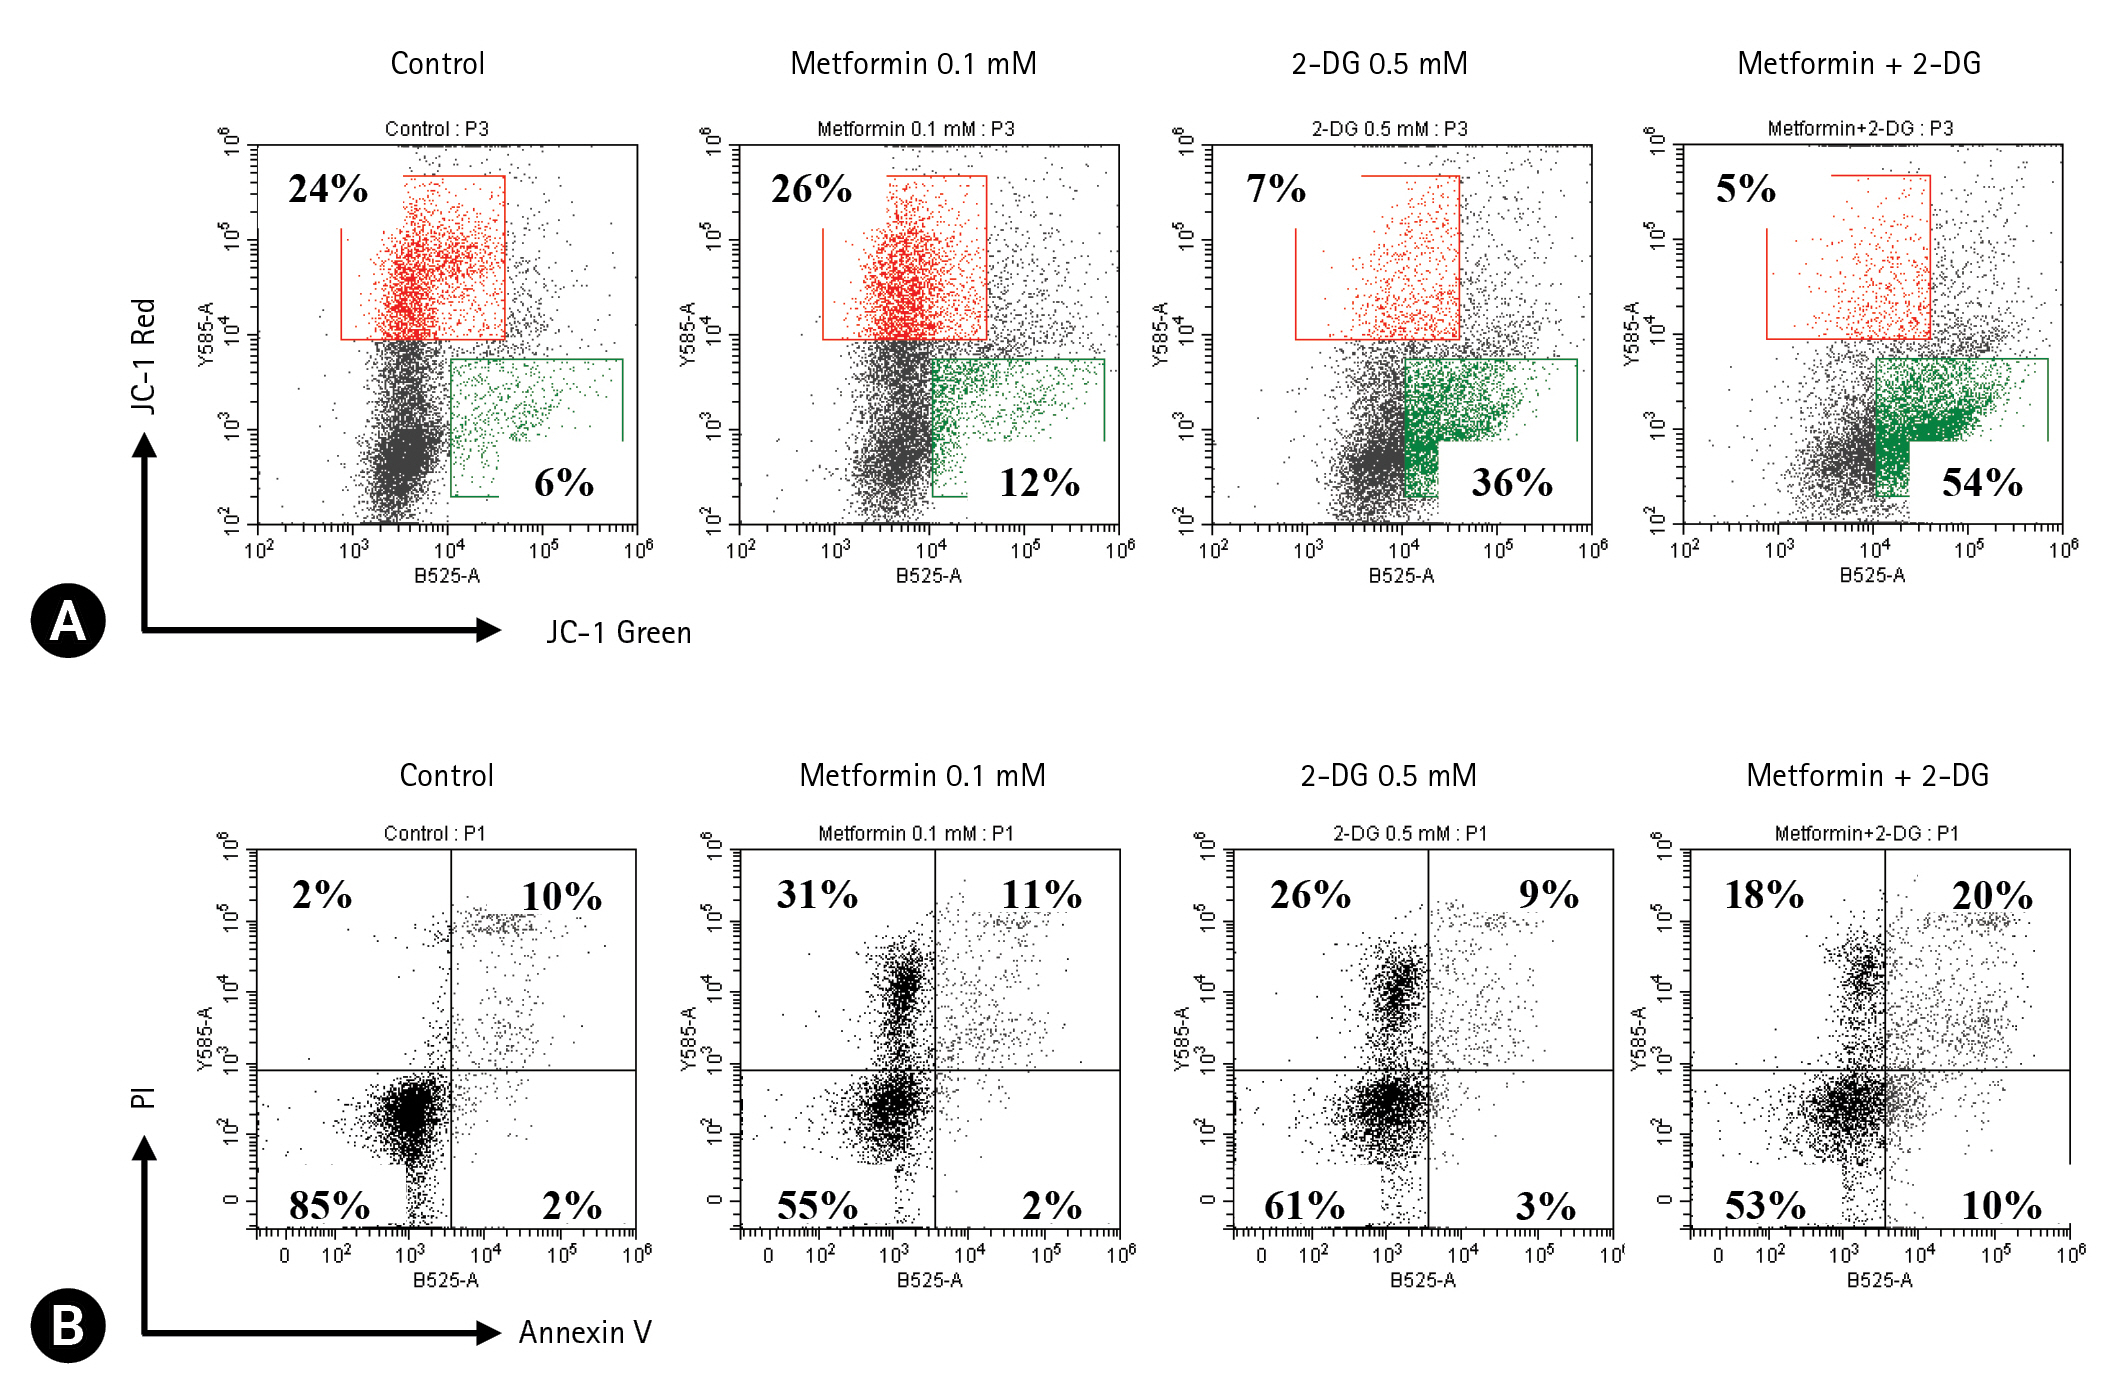
Effect of metformin + 2-deoxy-D-glucose (2-DG) on mitochondria membrane potential (MMP) reduction and apoptosis induction in EL4 cells. EL4 cells were cultured in 24-well culture plates at a concentration of 1 × 10⁵ cells/mL, and treated with metformin 0.1 mM or 2-DG 0.5 mM. (A) After one day, MMP was analyzed by staining with JC-1. The percentages of JC-1 green and JC-1 red indicate cells with low MMP and high MMP, respectively. (B) After two days, cell death was confirmed by flow cytometry by double staining with Annexin V and propidium iodide (PI). The cells in quadrants indicate live cells (Annexin V-/PI-), early apoptosis (Annexin V+/PI-), late apoptosis (Annexin V+/PI+), and necrosis (Annexin V-/PI+).
고찰
Metformin은 인슐린 비의존성 당뇨병 치료제로 오랜 기간 사용되었다[1]. 당뇨병 환자에서 항암 효과가 처음 밝혀진 이후 여러 암에서 그 항암 효과가 보고되었으며, 주로 세포 대사와 관련된 기전으로 작용한다[6–10]. Metformin에 의한 미토콘드리아 complex Ⅰ의 억제는 mitochondrial reactive oxygen species (mitochondrial ROS)/hypoxia-inducible factor-1에 의한 스트레스 신호를 유발하여 포도당의 사용을 늘리고 해당과정을 촉진한다[19]. 2-DG는 포도당 유사체로서 해당과정을 억제하여 세포의 에너지 결핍을 유발하는데[15,16], 위 두 가지 약물의 기전을 고려하여 병용 투여 시 항암 효과 증가를 기대하였다. 본 연구에서는 마우스 T 림프종 세포에서 metformin 단독 투여 시의 항암 효과와 2-DG를 병용 처리했을 때의 항암 효과 변화를 확인하였다.
Metformin은 EL4 세포에서 세포 대사활성도와 살아있는 세포수의 감소를 유발하였으며, 특히 0.4 mM에서 충분한 항암 효과를 보였다. 하지만 세포생존율에는 큰 변화를 보이지 않았다(Figs. 1, 2). 따라서 작용기전을 알아보기 위해 세포주기 분석을 시행하였고, metformin이 G2/M기 정지를 통한 세포사를 나타냈음을 확인하였다(Fig. 3). 세포주기의 불균형은 종양세포 발달의 초기 단계로 세포주기 조절을 통해 항암 효과를 유발할 수 있다. G2기의 검문지점은 유전체 손상 확인 시 DNA 유사분열을 막고 세포주기를 정지시켜 세포사멸을 유도한다[20]. 이러한 기전이 세포사 확인 실험에서 살아있는 세포수의 급격한 감소에 비해 세포생존율의 차이가 크지 않았던 요인 중 하나가 될 수 있을 것이라 생각된다. 추가적으로 metformin의 tumor necrosis factor (TNF)-alpha 발현 유도 가능성을 확인하고자 enzyme-linked immunosorbent assay를 수행하였으나, TNF-alpha의 유의미한 발현 차이는 나타나지 않았다(data not shown). 또한 ROS 관련성을 확인하고자 N-acetyl-L-cysteine (NAC; Sigma-Aldrich)를 처리하여 MTT assay와 trypan blue exclusion test를 통해 세포 대사활성도와 세포사 변화를 관찰하였으나, 이에 대한 유의미한 차이는 보이지 않았다(data not shown).
Metformin과 2-DG를 병용 처리 후 세포 대사활성도를 확인한 결과 metformin 0.016–0.4 mM에서 2-DG를 0.5 mM, 1 mM씩 처리했을 때 상가효과(additive effect)를 보였다. 이는 metformin이 세포 에너지 이용 과정에서 해당과정을 통한 포도당 대사를 주로 하도록 유도하고, 2-DG가 포도당 유사체로 들어가 해당과정을 억제하여 병용 효과를 나타냈을 것으로 생각된다[19]. 2-DG 1 mM을 처리한 세포군의 경우 metformin 4 mM에서 충분한 항암 효과를 보여 그 이후 농도에서 추가적인 급격한 감소는 보이지 않았다. 세포사 확인 실험에서는 살아있는 세포의 수가 Metformin과 2-DG 병용 처리시 각각의 약물 단독 처리 시보다 감소하여 항암 효과의 증가를 보여주었으나 세포 생존율의 차이는 거의 없었다(Fig. 4). 위 결과의 기전을 알아보기 위해 MMP 분석과 세포사 형태 분석을 진행하였다. 세포사 초기 단계의 특징 중 하나는 미토콘드리아의 기능 손실이다. JC-1은 미토콘드리아 막을 통과하는 염색 시약으로 MMP가 높은 상태에서는 J-aggregate 상태로 미토콘드리아 내부에 축적되어 적색의 형광을 나타내며, MMP가 낮은 상태에서는 미토콘드리아 세포질에서 monomer 상태로 존재하여 녹색의 형광을 나타낸다. Metformin이 2-DG에 비해 MMP 감소 효과가 크지 않았음에도 necorsis를 더 많이 유도한 것으로 보아 MMP 이외의 기전이 metformin의 항암 효과에 기여했을 것으로 생각되며, G2/M기의 정지도 그 중 하나가 될 수 있겠다(Figs. 3, 5). Metformin + 2-DG 병용 처리로 인해 약물의 단독 처리보다 MMP 감소 효과가 더 커졌으며, apoptosis의 비율이 증가하였다. 이는 두 약물의 병용 효과에 MMP 감소와 apoptosis 증가가 영향을 미쳤음을 알려준다(Figs. 4, 5). 림프종 치료에 사용되는 대부분의 기존 화학요법 항암제들은 부작용이 심하다[11]. 하지만 metformin과 2-DG는 부작용이 적은 대사성 항암제이며 특히 metformin 0.4 mM + 2-DG 1 mM에서 높지 않은 농도로 효과적인 상가효과를 나타낸다는 점에서 기존 화학요법 항암제들의 대체 약물로써의 후보가 될 수 있다. 해당 연구에서는 in vitro 상에서 T-세포 림프종에 대한 metformin과 2-DG의 병용 처리시 항암 효과가 확인되었다. 림프종 이외의 종양에서 병용 투여시의 항암 효과와, in vivo에서 림프종 모델에 대한 metformin과 2-DG 병용 투여 시의 항암 효과와 부작용에 대한 추가적인 연구가 필요하다.
Notes
The authors declare no conflict of interest.
Acknowledgements
본 연구는 2023학년도 '제주대학교 교원성과지원사업'에 의하여 수행되었으며, 이에 감사드립니다.