Image quality assessments of focal spot size on radiographic images in dogs
Article information

Abstract
The aim of this prospective study was to investigate the effects of focal spot size of X-ray tube on sharpness of clinical radiographic images of dogs and cats. Radiographic images of 24 stifle joints, 15 carpi, 18 lumbar spines, 61 thoraxes, and 47 abdomens of 102 dogs and 4 cats were obtained in the present study, using 2 X-ray tubes with nominal focal spots of 2.0 mm and 0.6 mm, respectively. The sharpness of specific anatomical structures in all the images of 5 projections was assessed. The radiographic sharpness of various anatomical structures of lumbar spine and cortex of stifle with fine focal spot was increased significantly compared with broad focal spot images. In addition, the blurred motion was significantly higher in the fine focal spot images of thorax. In conclusion, our study suggests that a selective use of fine foci for imaging of lumbar spine or cortex of stifle enhanced radiographic sharpness.
Introduction
Image quality in radiography is defined by spatial resolution, contrast, and noise [1]. Spatial resolution is the ability to distinguish between 2 adjacent small objects or the distinct edge in the image, which is referred to as sharpness [1,2]. Spatial resolution depends on various factors, such as the size of the focal spot, patient’s motion, and crystal size in the intensifying screen [3].
A decrease in focal spot size results in a smaller penumbra when other factors such as the object-image distance, and focal spot-film distance (FFD) remain unchanged [4,5].
The power loading limitations in small focal spots require reduction in the tube current to approximately one-fourth of the size used with the corresponding large focal spots [6]. Consequently, the lower X-ray tube currents are associated with longer exposure time, which may increase the likelihood of blurred motion in radiographic images [6,7]. The motion unsharpness can be minimized by asking the patient to remain still or hold the breath [7], which is almost impossible in case of dogs and cats. Additionally, compared with a large focal spot, the heat generated during X-ray production dissipates within the smaller area, in which repetitive thermal damage can induce pitting of the focal area surface [4,8].
The physical impact of focal spot size on radiographic exposure is undisputed [4]. However, there is a paucity of evidence supporting the relationship between these effects and clinical radiographic image quality [4], especially in veterinary medicine.
The aim of this study was to investigate the impact of specific focal spot sizes on the anatomical details of radiographic images.
Materials and Methods
Animals recruitment
The study was performed in dogs and cats undergoing radiographic evaluation at the Veterinary Medical Teaching Hospitals of Gyeongsang National University from September 27, 2017 to December 5, 2017. This study was a randomized, single-blind trial comparing image quality. All procedures were approved (GNU-170227-D0006) by the Institutional Animal Care and Use Committee at Gyeongsang National University. Radiography involved at least one of the following 5 anatomic regions: stifle, carpus, lumbar spine, thorax, and abdomen. Radiographic images of 31 stifle joints, 16 carpal joints, 18 lumbar spines, 61 thoraxes and 81 abdomens with broad focal spot size (BFSS) and fine focal spot size (FFSS), respectively, were obtained from 102 dogs and 4 cats.
Radiographic examination
Two X-ray tubes were used to acquire BFSS and FFSS images. BFSS images were taken with E7239X Rotanode Toshiba X-ray tube (Toshiba Electron Tubes and Devices Company, Japan) containing a nominal focal spot size of 2.0 mm. FFSS images were taken with E7252X Rotanode Toshiba X-ray tube (Toshiba Electron Tubes and Devices Company) containing a nominal focal spot size of 0.6 mm. Both X-ray tubes carried the tungsten-rhenium-molybdenum alloy targets with a target diameter of 74 mm.
All radiographic images were acquired using a Konica computed radiography system (Regius model 190; KONICA Minolta, Japan). All radiographic parameters including mAs, kVp, FFD, and postprocessing were identical to both examinations.
The mediolateral projections of right stifles were obtained at 90° flexion, including the full length of femur and tibia. The dorsopalmar projections of right carpus were obtained including the full length of humeri and distal phalanges. The lateral projections of the lumbar spine included 2 to 3 caudal thoracic spines. The right lateral projections of the thorax were acquired on peak inspiration. The right lateral abdominal radiographs were obtained on expiration and entire abdomen was included on the radiograph.
Image evaluation
Image criteria for each projection were based on anatomical details to evaluate the sharpness of BFSS and FFSS images. The criteria are shown in Table 1. All resulting DICOM images were reviewed with a DICOM view (RadiAnt DICOM Viewer ver. 4.6.9; Medixant Inc., Poland) and were evaluated by a single observer (S.J.). The observer scored individual criteria using a 4-point scale. The scoring system for each criteria was graded as 1, ill defined; 2, poorly defined; 3, acceptable; 4, well defined (Fig. 1).

Criteria for evaluating the sharpness of stifle, carpus, lumbar spine, thorax and abdomen radiographic images
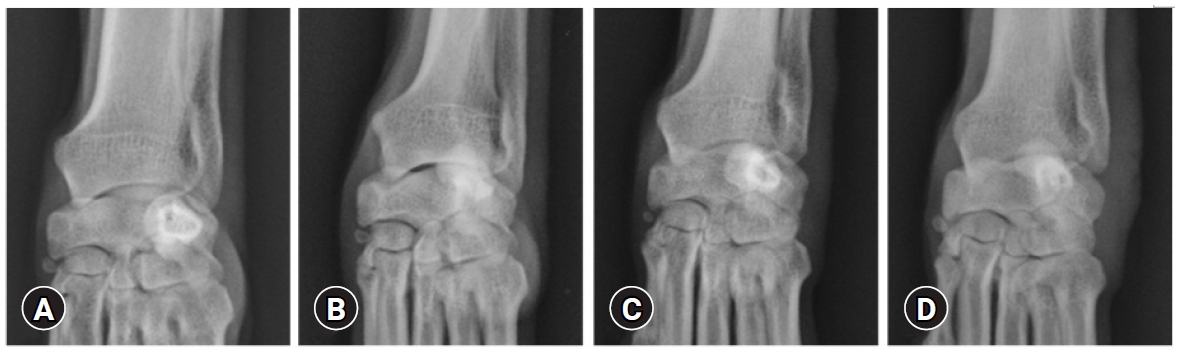
Evaluation of trabecular pattern of carpus using a 4-point scale. (A) 4 points: well defined trabecular pattern; (B) 3 points: acceptable trabecular pattern; (C) 2 points: poorly defined trabecular pattern; (D) 1 point: ill defined trabecular pattern.
For all thorax images, motion blur evaluation was also performed using a 3-point scale as follows: 1, structure not visible and/or complete evaluation not possible; 2, structure visible but evaluation limited; and 3, structure clearly visible, complete evaluation possible.
Statistical analysis
All statistical analysis was performed using commercial statistical software (IBM SPSS Statistics for Windows ver. 25.0; IBM Corp., USA). The intraobserver variability was calculated using intraclass correlation coefficient (ICC) [8,9], formula with a confidence interval of 95% to evaluate intraobserver reliability of all BFSS image criteria. ICCs > 0.75 were considered excellent, 0.4 < ICCs < 0.75 were between fair and good, ICCs < 0.4 were poor. The mean ± standard deviation of image scores was calculated for each criterion. The Wilcoxon signed rank test was utilized to assess the statistical differences in mean scores of each criterion between BFSS and FFSS. Values of p < 0.05 were considered significant.
Results
Seven of the 31 stifle joints and one of the 16 carpal joints were excluded because of orthopedic devices (n = 4), trauma (n = 1), and moderate bony proliferation (n = 3).
Among the 54 images of abdomen, 7 were excluded due to: severe constipation (n = 2), peritoneal effusion (n = 2), abdominal hernia (n = 1), splenectomy (n = 1), and pancreatitis with focal peritonitis (n = 1). Among the 81 images of thorax, 20 were excluded because of: severe cardiac enlargement (vertebral heart scale > 10.5) with or without pulmonary edema (n = 12), pleural effusion (n = 3), suspected lung nodule (n = 1), moderate bronchial mineralization (n = 2), peritoneal-pericardial diaphragmatic hernia (n = 1), and suspected mediastinal mass (n = 1). All feline radiographs were excluded for the above reasons. As a result, the BFSS and FFSS images of 24 stifles, 15 carpi, 18 lumbar spines, 61 thoraxes, and 47 abdomens were assessed in dogs.
Intraobserver reliability of the evaluation
The ICCs for intraobserver reliability are shown in Table 2. Intraobserver reliability was fair to good (n = 13) and excellent (n = 6) based on most criteria including motion blur, while the lung parenchyma and interstitium showed poor intraobserver reliability.
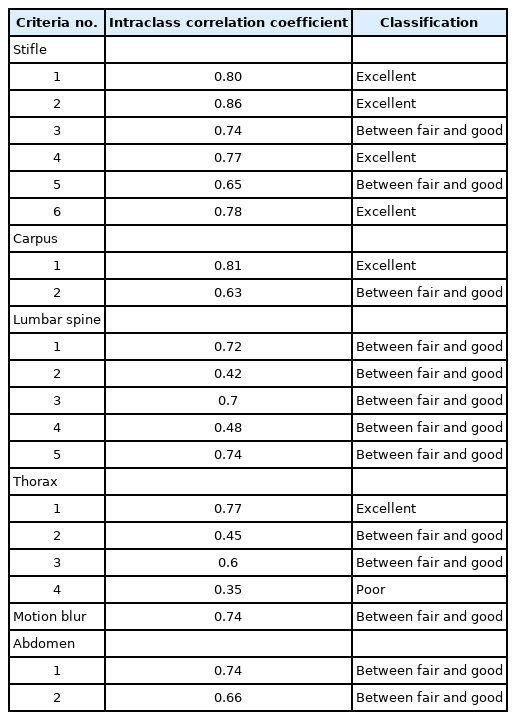
Evaluation of intraobserver reliability using intraclass correlation coefficient
Comparison of sharpness between BFSS and FFSS images
Significant differences were only found between BFSS and FFSS for all criteria of lumbar spine and cortical bone of stifle (p < 0.05) (Figs. 2, 3). No statistically significant differences were found based on any single criterion for carpus, thorax and abdomen (p < 0.05).
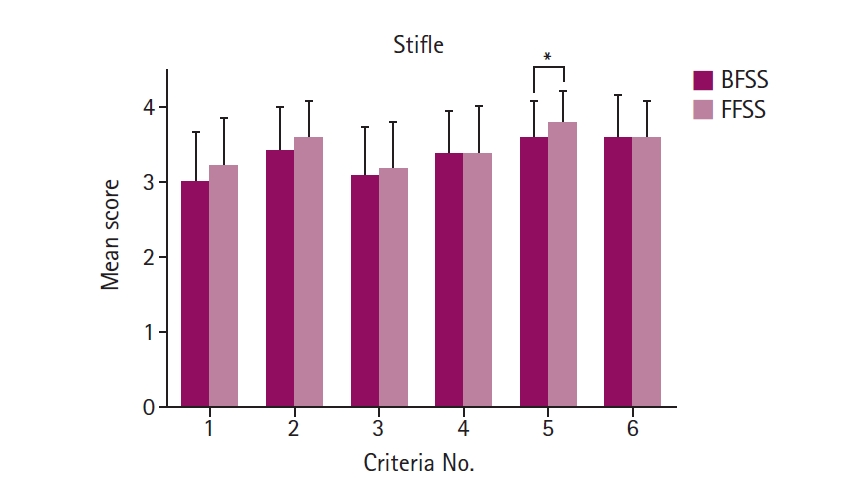
Comparison of mean criteria scores for stifle images at each focal spot size. Each value represents the mean ± standard deviation. Single asterisk (*) indicates statistically significant difference at p < 0.05. Criteria: no. 1, sharply defined patella ligament; no. 2, sharply defined infrapatellar fat pad; no. 3, sharply defined extracapsular fascial stripe caudal to joint capsule; no. 4, sharply defined popliteal lymph node; no. 5, sharply defined cortical outlines; no. 6, sharply defined trabecular pattern. BFSS, broad focal spot size; FFSS, fine focal spot size.

Comparison of mean criteria scores for lumbar spine images at each focal spot size. Each value represents the mean ± standard deviation. Single asterisk (*) indicates statistically significant difference at p < 0.05. Two asterisks (**) indicate statistically significant difference at p < 0.01. Criteria: no. 1, sharply defined endplate surface; no. 2, sharply defined intervertebral joint space; no. 3, sharply defined intervertebral foramen; no. 4, sharply defined cortical outlines; no. 5, sharply defined trabecular pattern. BFSS, broad focal spot size; FFSS, fine focal spot size.
Comparison of motion blur between BFSS and FFSS images of thorax
A significant difference in motion blur was detected between BFSS and FFSS (p < 0.05). Visibility was reduced due to higher motion blur in FFSS images than in BFSS images (Fig. 4).

Comparison of mean visibility scores of thoracic images at each focal spot size. Reduced visibility due to motion was higher in fine focal spot size (FFSS) images. Single asterisk (*) indicates statistically significant difference at p < 0.05. Each value represents the mean ± standard deviation. BFSS, broad focal spot size.
Discussion
Focal spot sizes are characterized as “actual”, “effective” and “nominal” focal spots. The actual focal spot is a radiographic target viewed from a position perpendicular to the target surface [4,10]. The effective focal spot is the focal spot area projected perpendicularly onto the image receptor [4,11]. The nominal size is the effective focal spot size as stated by the manufacturer [4]. Although the effective focal spot sizes of 2 X-ray tubes used in this study were not measured quantitatively, BFSS and FFSS were based on the nominal size.
In this study, the intraobserver reliability of most criteria ranged between fair and good (n = 13) and excellent (n = 6). However, the thorax criterion of lung parenchyma and interstitium showed a significantly poor reliability (ICC = 0.35). The reproducibility of radiographic evaluation for lung parenchyma and interstitium was poor. The subjective interpretation of thoracic radiography limits reproducible and reliable evaluation. Furthermore, due to the distribution of blood vessels, lymphatics, and bronchi, the radiological appearance of the pulmonary interstitium is very heterogeneous, which complicated the evaluation.
A smaller focal spot size yields higher spatial resolution and better radiographic images [2] due to the finite size of the focal spot [12]. Since the physical and mathematical impact of focal spot size on geometric unsharpness is well known, X-ray sources with a fine focus are preferably used for small body parts, particularly extremities, to enhance the image resolution of trabecular patterns [4,9]. In humans, the quality of clinical imaging was improved when fine focal spots were reported in previous studies of magnification mammography and lymphangiography [13,14]. However, one study assessing the sharpness of specific anatomical structure in radiographic images of the human ankle, knee, thoracic spine and lumbar spine found no statistically significant differences between FFSS and BFSS images [4]. In this study, compared with BFSS images, the stifle with FFSS images showed significant differences in the sharpness of cortical bone. However, for carpus, the statistical analyses did not reveal any significant differences between the 2 foci. In particular, the lumbar spine with FFSS revealed significantly better image quality in all criteria than BFSS, most likely due to the longer object-film distance (OFD) of the lumbar spine compared with stifle or carpus. As thickness of body part increases, OFD increases, creating a wider penumbra [9]. The use of BFSS tube may magnify this penumbra, resulting in a significant reduction in the sharpness of lumbar spine images with BFSS.
In this study, the thoracic and abdominal radiographic images did not reveal any differences between the 2 foci for any single criterion. In humans, a previous study reported that abdominal computed tomography (CT) scan with fine focus (0.6 × 0.7 mm) revealed significantly clearer margin of organs and lesions compared with the standard focus (1.1 × 1.2 mm) CT scan [15]. This finding might be attributed to the inherent advantages of CT scan such as tomographic nature and higher contrast resolution [16]. In the absence of significant differences between all soft tissue criteria of stifle as well as thorax and abdomen, the analysis of soft tissue sharpness using small foci is of limited benefit.
Thoracic radiographs should be acquired at peak inspiration to minimize motion artifacts and optimize pulmonary contrast [17]. Use of a fine focal spot entails longer exposure time than a broad focal spot [7], which might lead to motion blur and result in poor image quality [6,7]. In this study, although all radiographic images of thorax were intended to be acquired at peak inspiration, the statistical analyses revealed further reduction in the visibility of FFSS images compared with BFSS images.
In conclusion, this study demonstrates that the fine foci improve radiographic sharpness of various anatomical structures of lumbar spine and stifle cortex. However, assessing the soft tissue margin with fine foci has no clear benefit, and may increase the likelihood of motion in thoracic radiography.
Based on this study, the selective use of fine foci may facilitate the diagnosis of veterinary cases.
Notes
The authors declare no conflict of interest.